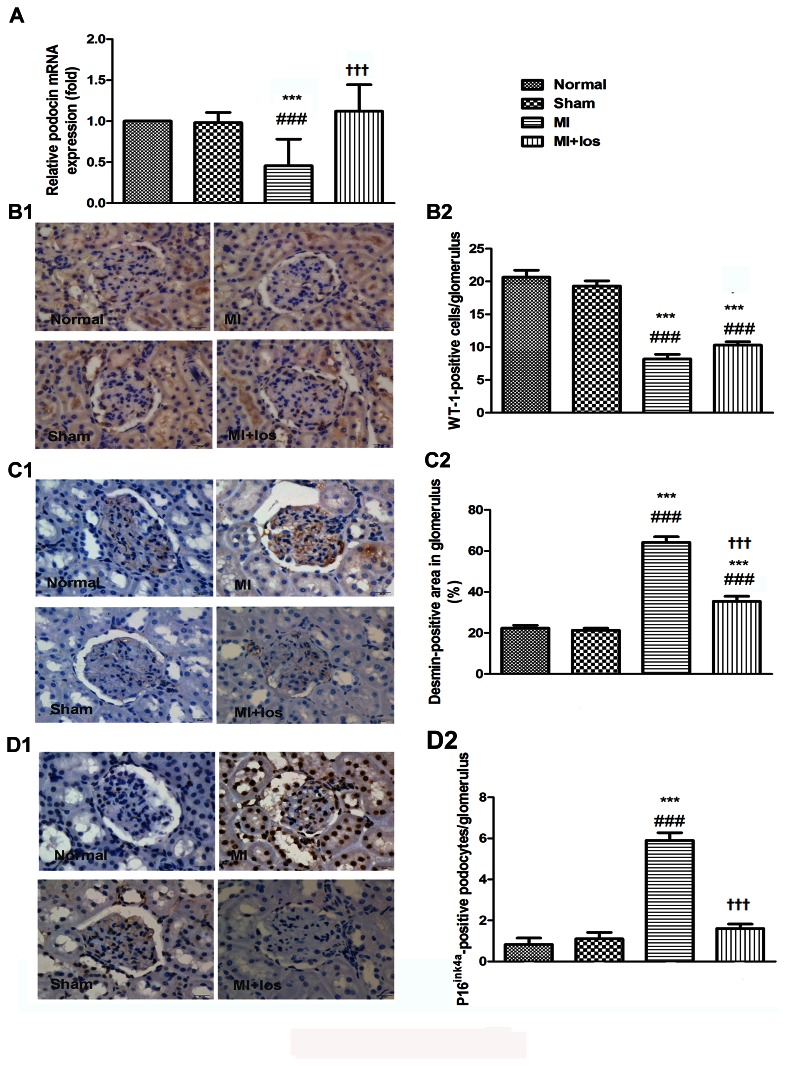
Figure 2. Representative podocyte injury in normal, sham, MI and MI+los rats at 3 weeks.
(A) Podocyte injury revealed by mRNA expression of glomerular podocin (B1) Representative immunohistochemical staining for WT-1 (original magnification, ×400) (B2) The average number of WT-1-positive podocytes per glomerulus (C1) Representative immunohistochemical staining for desmin (original magnification, ×400) (C2) The relative desmin-stained area in the glomerulus as a percentage of total glomerular area (D1) Representative immunohistochemical staining for p16ink4a (original magnification, ×400) (D2) The average number of p16ink4a-positive podocytes per glomerulus. Data are presented as the mean ± SEM. ###P < 0.008 vs. normal; ***P < 0.008 vs. sham; ††† P < 0.008 vs. MI. MI, myocardial infarction; los, losartan; WT-1, Wilms’ tumor-1.

