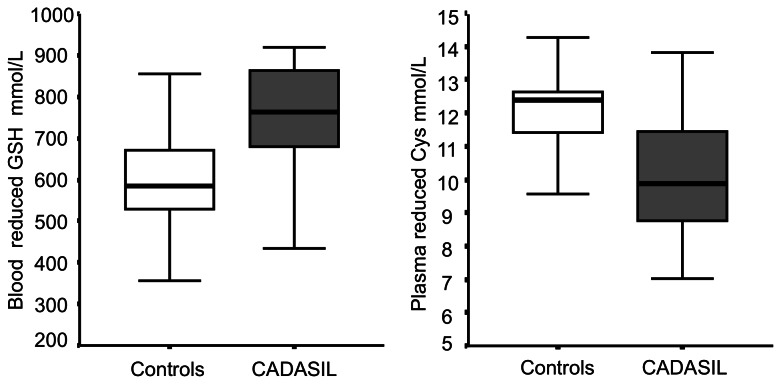
Figure 1. Reduced plasma Cys and blood GSH in controls and CADASIL patients.
Box plot of the distribution of reduced plasma Cys and blood GSH concentrations in controls (empty box) and CADASIL patients (dark box). The horizontal line in the middle of each box indicates the median; the top and bottom borders of the box mark the 75th and 25th percentiles, respectively; and the whiskers represent the highest and lowest values that are not outliers or extreme values.

