
Figure 4. Relationship of white matter FA with working memory scores.
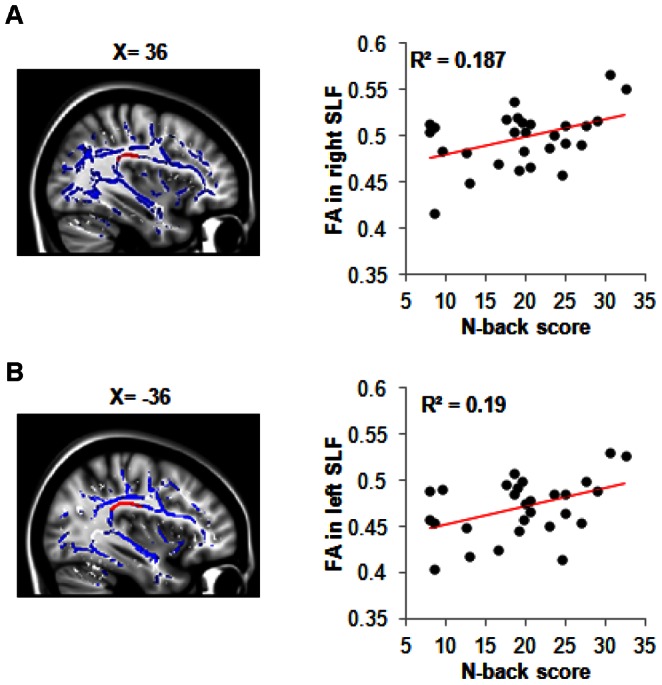
(A) Sagittal view of the right superior longitudinal fasciculus (SLF) ROI’s (red) overlaid onto the mean FA tract skeleton for GWI subjects (n = 28), with scatterplot showing a relationship between right SLF and mean 2-back score (P = 0.010) (B) Sagittal view of left SLF ROI (red) overlaid onto the mean FA tract skeleton for GWI subjects (n = 28), with scatterplot showing a relationship between left SLF and mean 2-back score (P = 0.011).