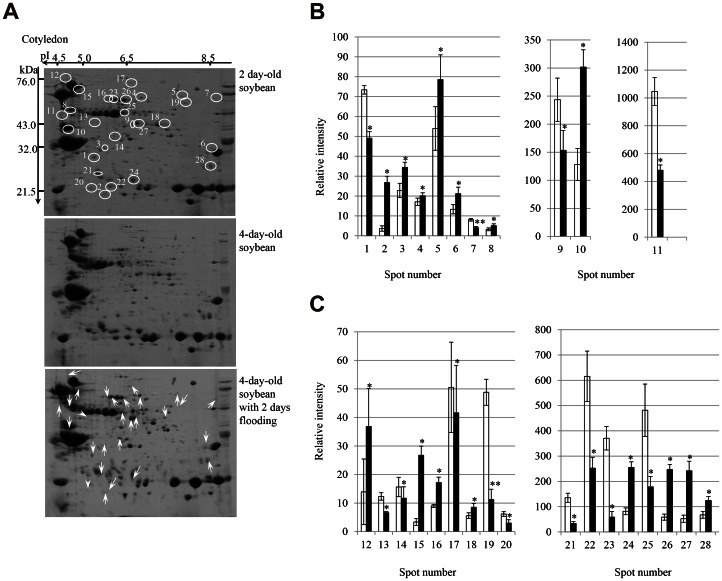
Figure 2. 2-DE pattern and relative abundance of proteins in the cotyledon of flooding-stressed soybean plants.
Two-day-old soybean plants were flooded for 2 days, after which proteins were extracted from the cotyledon, separated by 2-DE, and the gels were stained with CBB (A). Open circles denote protein spots showing altered staining intensity. Upward and downward arrows indicate increase or decrease in intensity, respectively. The differential abundance of proteins was determined using PDQuest software and is plotted as the relative intensity (B and C). Results are presented as the mean ± SE of relative protein intensity for gels from 3 biological replicates (Figure S2). Differences were compared using the Student’s t test (*P<0.05, **P<0.01). White and black bars show control and treatment, respectively. Spots numbers are the same as shown in panel A.

