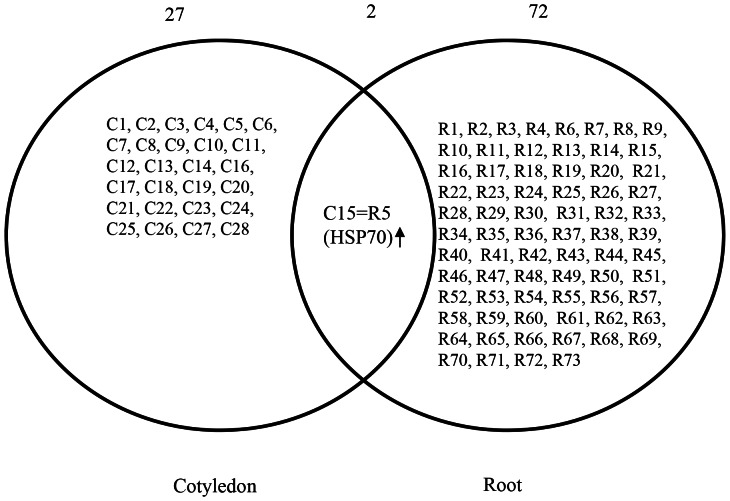
Figure 3. Venn diagram analysis of root and cotyledon proteins of flooding-stressed soybean plants.
Diagram shows root and cotyledon proteins that changed in abundance in response to flooding stress. The overlapping area shows the common protein to both root and cotyledon that decreased in abundance in both organs. Numbers at the top of the diagram indicate the number of proteins. Downward arrow indicates a decrease in staining intensity. The numbers within the circles correspond to the proteins listed in Table 1 and Table 2.

