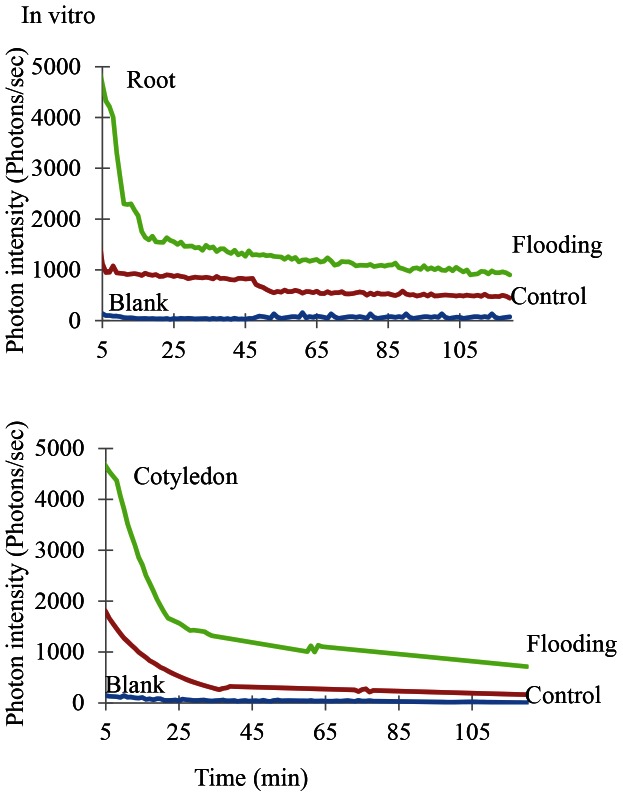
Figure 4. In vitro biophoton emission patterns of flooding-stressed soybean plants.
Two-day-old soybean plants were flooded for 2 days, after which proteins were extracted from the root and cotyledon and H2O2 was added. Emission of photons from these extracts was then measured. Three independent biological replicate analyses of the root and cotyledon were performed (Figure S3). Ground photon emission by the empty Petri dish served as a blank (blue). Green lines represent biophoton emission from flooding-stressed soybean plants, while red lines represent biophoton emission from untreated soybean plants.

