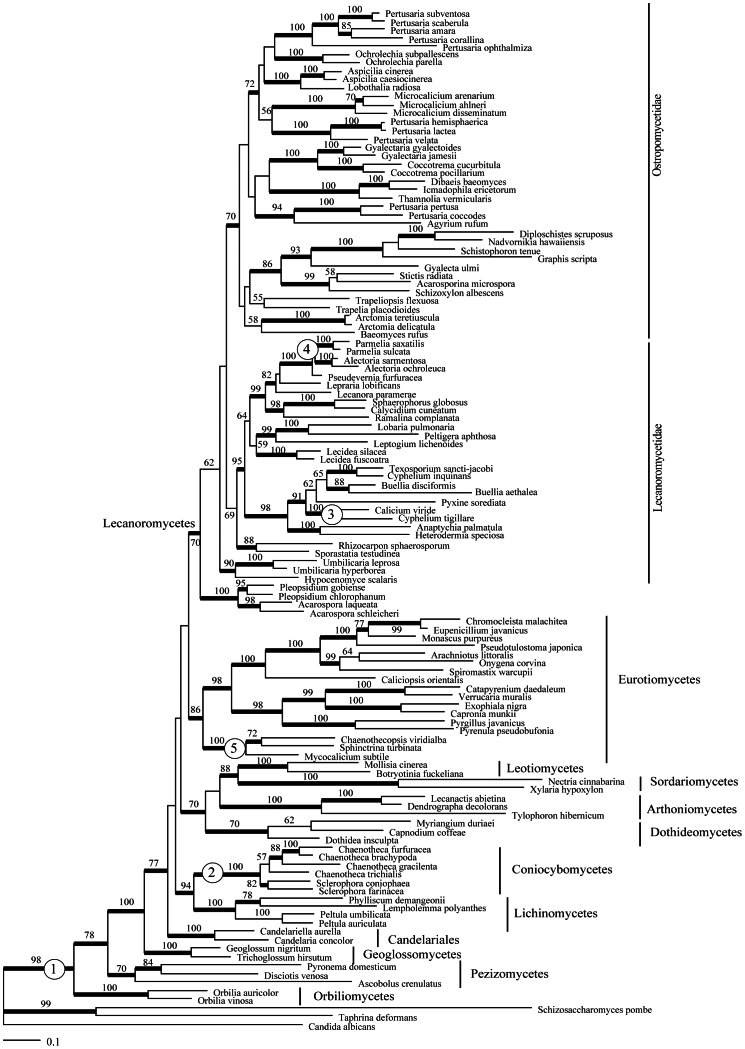
Figure 1. Best tree from the maximum-likelihood analysis.
Numbers in circles indicate the nodes used for fossil calibration: (1) Paleopyrenomycites devonicus; (2) Chaenotheca sp.; (3) Calicium sp.; (4) Alectoria succinica or Parmelia ambra; and (5) Chaenothecopsis sp. Numbers above branches correspond to bootstrap support values and thicker branches show bootstrap support >70%.

