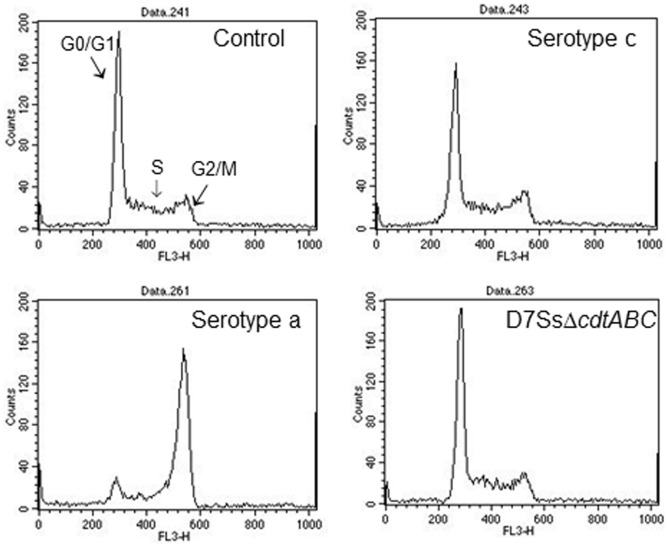
Figure 3. Histogram from flow cytometric analyses of leukocytes (HL-60 cells) exposed for 24 h to different extracts from various isolates of A. actinomycetemcomitans.
The DNA-content of each exposed HL-60 cell were determined with PI-staining and indicate cell cycle phase of the analysed cell. The upper left panel (control) was exposed for 0.1% isoton NaCl, the upper right panel for 0.1% NaCl extract from an isolate with non-complete cdt-genome, the lower left panel for 0.1% NaCl extract from an isolate with intact cdt-genome and the lower right panel exposed to 0.1% NaCl extract from a cdt knockout mutant strain (D7SSΔcdtABC).

