
Figure 2. Fluorescence Activated Cell Sorting of triple positive cells.
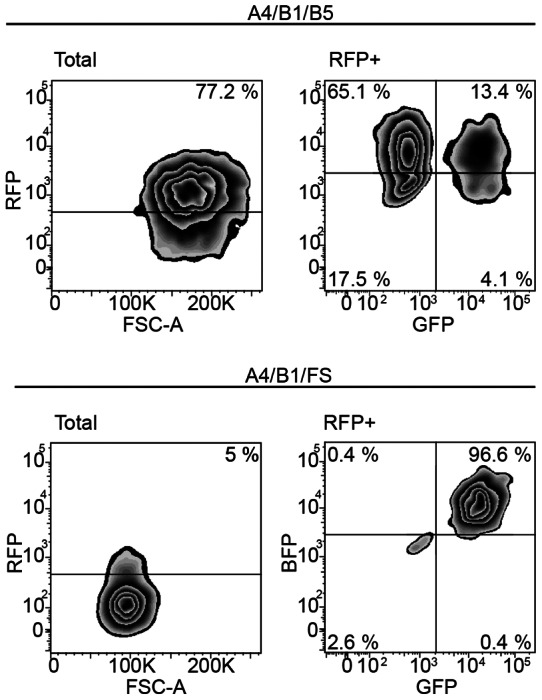
Cytometry analysis of the triple positive cells to be sorted. The Total zebra plot depicts the RFP fluorescence in logarithmic scale versus the forward scattering and on top of the threshold, the percentage of positive cells. The RFP+ plot shows the blue and the green fluorescence from the RFP positive cells only, thus the right upper population represents the triple positive cells.