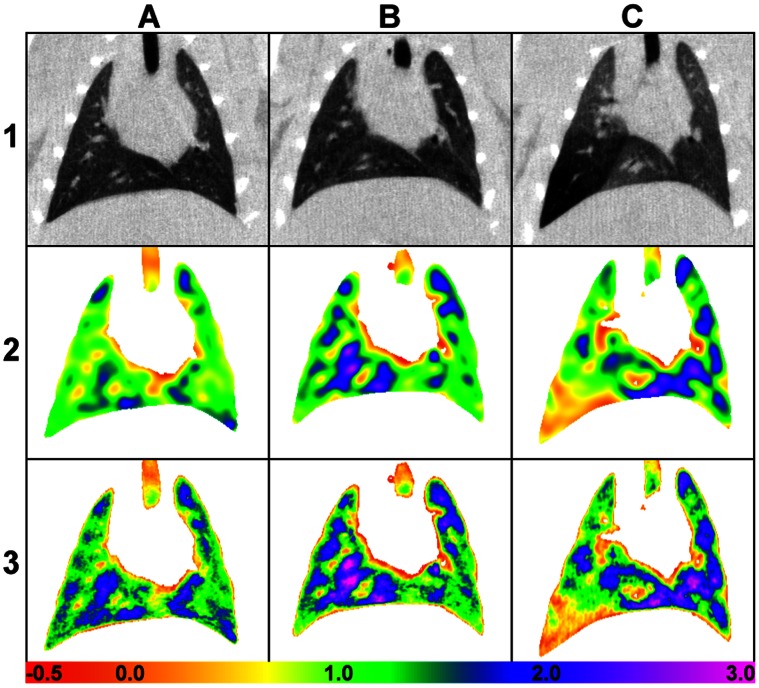
Figure 5. Sample registration results.
Column A: control. Column B: full-lung dosed. Column C: single-lobe dosed. Row 1: coronal images, unprocessed. Row 2: Jacobian maps, between the lowest and highest inflation levels. Row 3: volume maps. The color scale represents the volume change (×10−6 mL) in each voxel between 0 cmH2O and 8 cm H2O.

