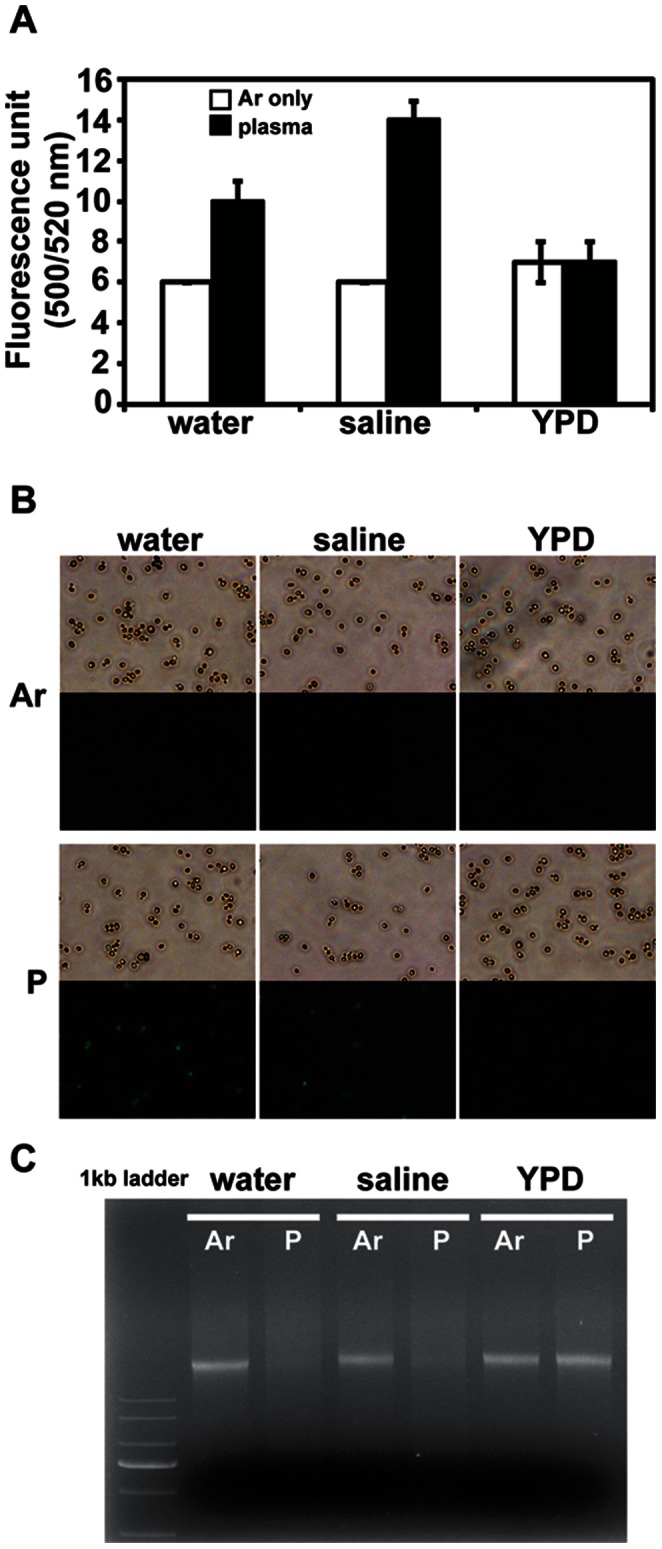
Figure 3. Lipid peroxidation and genomic DNA stability analyses.

Yeast cells (2×10⁷) were exposed to Ar gas and plasma for 3 min and used for the analyses of lipid peroxidation and genomic DNA. (A) Production of 4-hydroxynonenal (4-HNE) measured as fluorescence intensity at 500/520 nm in cells treated with plasma in water, saline, and YPD. Each value is the average of three technical replicates. (B) Fluorescence image of cells after Ar gas and plasma treatment in water, saline, and YPD. (C) Agarose gel electrophoresis of genomic DNA. Same amount of genomic DNA (2 µg) was loaded on the 1% agarose gel.
