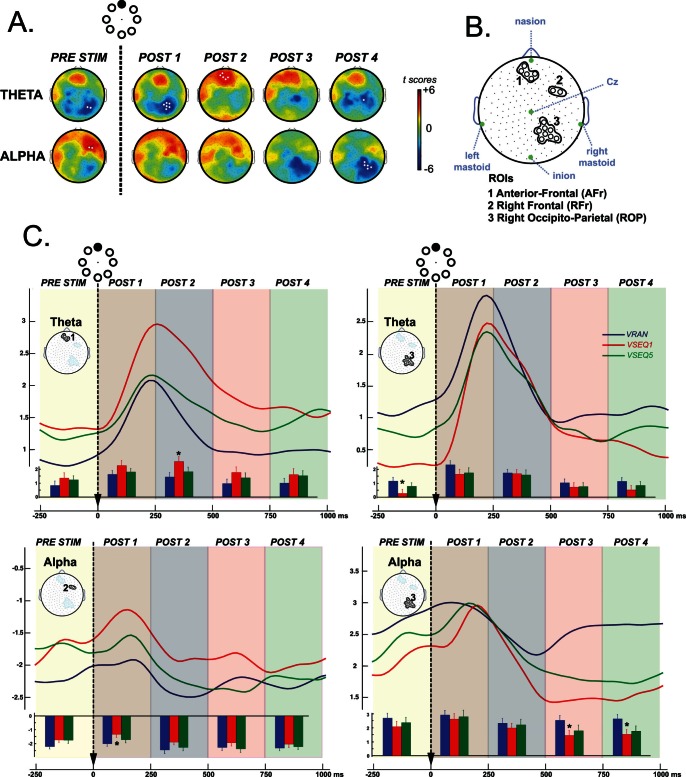
Figure 3. Spectral power analysis.
A. Statistical nonparametric mapping analysis of the difference between VRAN and the average of the five blocks of VSEQ in five 250-ms temporal windows for theta and alpha frequency bands. The white circles indicate electrodes with significant power differences. B. Identification of the three ROIs based on significant power differences in A. C. Time course of the average normalized spectral power VRAN (blue), VSEQ1 (red) and VSEQ5 (green) for the three ROIs in B. in theta (upper row) and alpha (lower row) frequency bands. Bars at the bottom of each graph represent the mean power (± SE) for the corresponding time interval, with asterisks indicating significant (p<0.05) contrasts.

