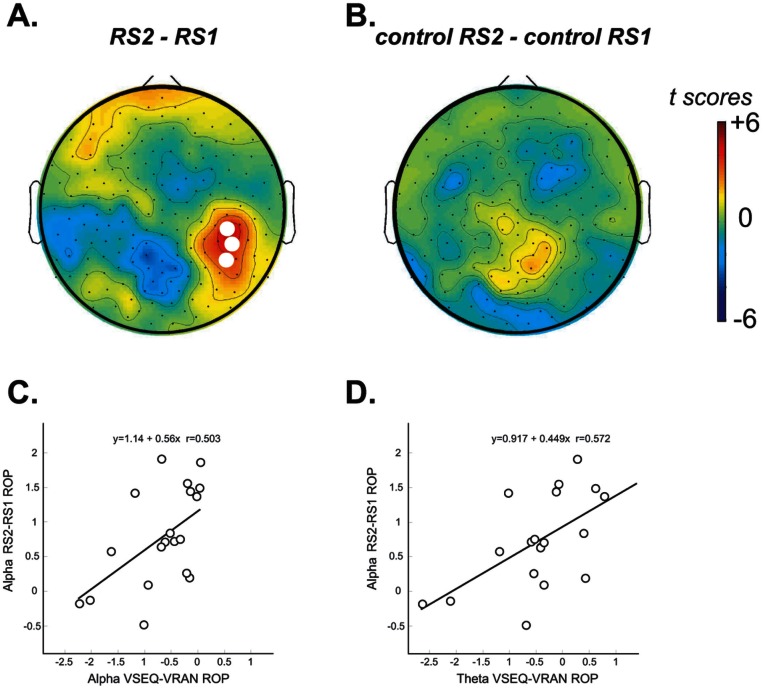
Figure 5. Resting state naTop row: Changes in spontaneous resting state EEG after forty-minute sequence learning tasks (A.) and after forty-minute performance in a variety of different motor tasks (B.).
White circles indicate electrodes with significant power differences between RS2 and RS1. Bottom Row: Correlations between the changes in resting state EEG (alpha range) and the VSEQ-VRAN changes observed 250 ms pre- and post-stimulus in the alpha (C) and theta ranges (D).

