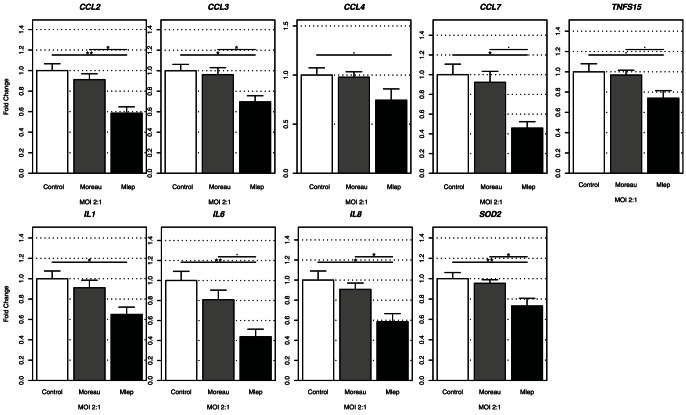
Figure 1. Gene expression in M. leprae and BCG infected THP-1 cells.
THP-1 cells were infected with BCG Moreau (gray columns) or M. leprae (black columns) at a MOI 2∶1 for 24 hours (n = 6) or uninfected (control, white columns). Among the 47-gene set only genes that showed at least a suggestive result (n = 9) are presented. Two-tailed levels of significance less than or equal to 0.01 (**), 0.05 (*) and 0.1 (.) were considered as “highly significant”, “significant”, and “suggestive”, respectively.

