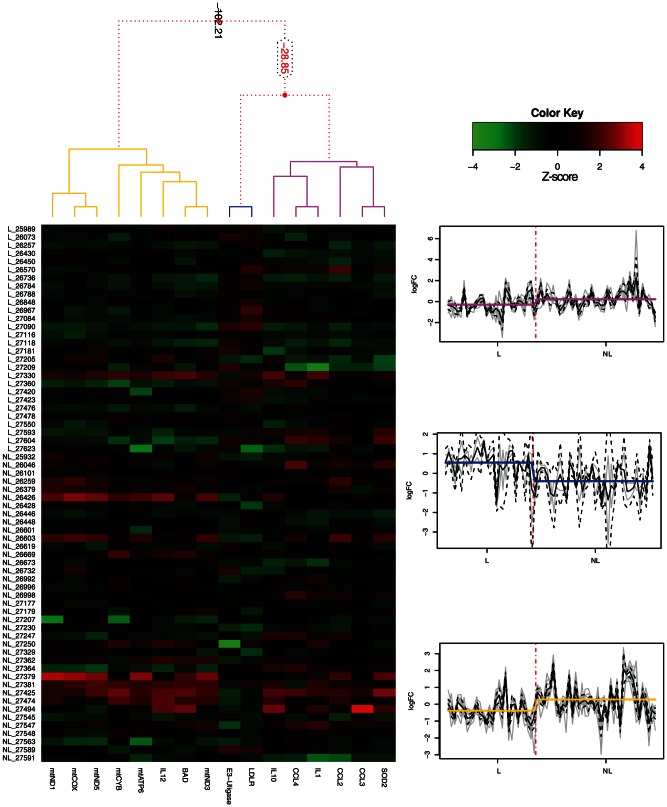
Figure 3. Clustering of differentially expressed genes in nerve biopsies of leprosy and non-leprous patients peripheral neuropathy.
The left graph displays a dendrogram representing the 1D clusterization of genes and the 2D map corresponding to the levels of standardized gene expression profiles (z-score), while the graph on the right displays the three significant clusters (pink, blue and yellow). Red dotted lines in the dendrogram (up-left) indicate weak unions, discouraged by the Bayesian clustering analysis. Values represented in the dendrogram branches correspond to log-odds of the union of corresponding branches. Gray lines in the graphs on the right indicate gene z-scores on leprosy and non-leprous samples, while black solid and dotted lines represent the mean and CI95% of the mean for all genes belonging to each cluster, respectively. Solid pink, blue and yellow lines indicate the mean of all genes in all samples belonging to the leprosy and non-leprous groups.

