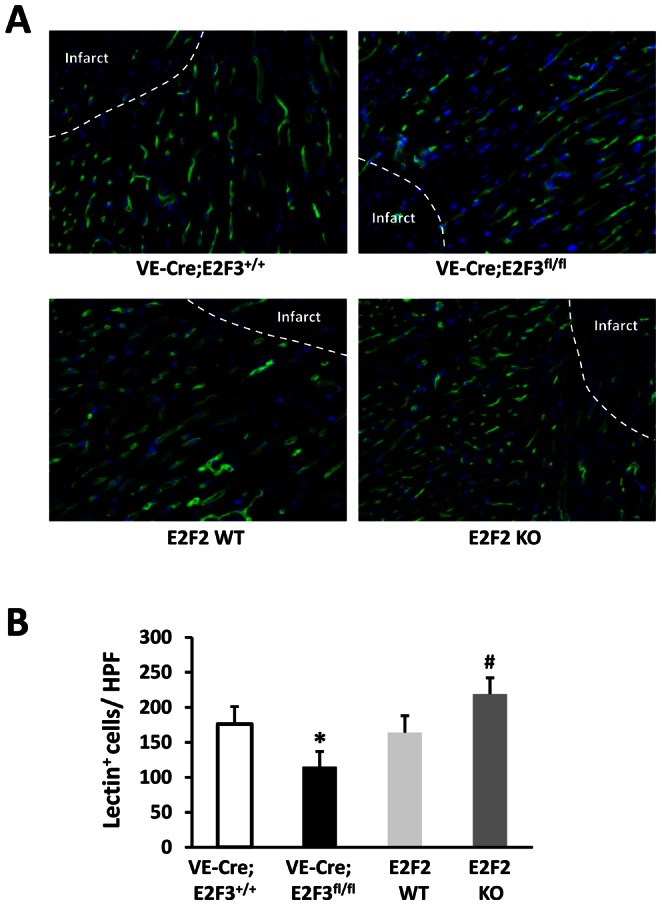
Figure 3. The vascular density at infarct border zone is greater in E2F2 KO mice and lower in endothelial E2F3 KO mice than in their WT littermates.

Blood vessels were stained with BS lectin 1 (green), and nuclei were counterstained with DAPI (blue). (A) Representative immunofluorescence images. (B) Quantification of vascular density at the infarct border zone. n = 12 mice per group; *P<0.05 vs. VE-Cre; E2F3+/+, #P<0.05 vs. E2F2 WT; HPF, high power field.
