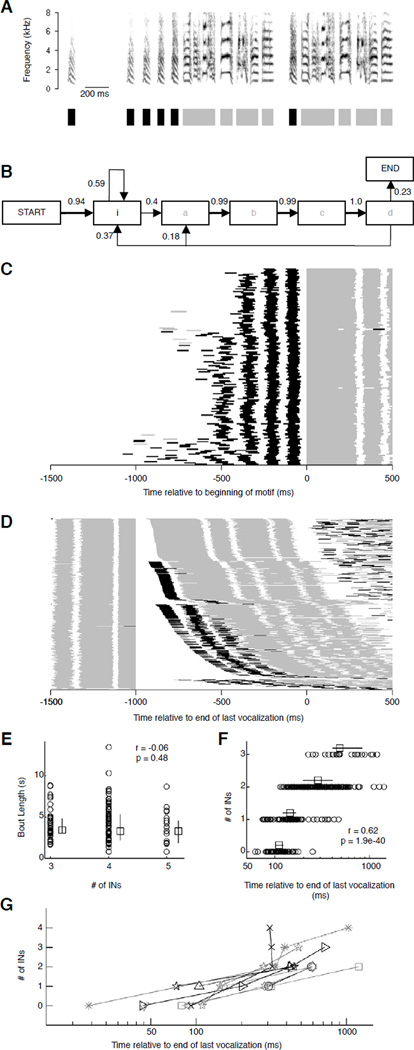
Figure 1.
Number of introductory notes varies and can depend on the time since last vocalization. (A) Spectrogram of one song bout (top) with 5 introductory notes (INs, ‘i’) before the bird's characteristic motif comprising 4 syllables (‘a’, ‘b’, ‘c’ and ‘d’) separated by gaps. To visualize INs across multiple bouts, we generated an IN/Non-IN representation (bottom) where syllables and gaps were replaced with appropriately timed colored bars: black (INs), gray (non-INs), and white (silent periods). (B) Syllable transition diagram generated from 157 song bouts (same bird as in A). Nodes represent syllables, direction and thickness of arrows between nodes represent syllable transitions and associated probabilities (numbers above arrows also represent transition probabilities). Calls have been omitted for clarity, and account for all missing transitions. (C) IN/Non-IN representation of the beginning of 157 song bouts from one bird, each aligned at motif onset (t=0). Bouts are arranged in ascending order of number of INs. (Small gray bars seen in (C) and (D) before IN sequences on some trials are calls that differ from INs in their acoustic structure – see Fig. S1D,E). (D) Representation of 379 motifs aligned to the end of the previous motif (t=0). Motifs are arranged in ascending order of number of INs, and within groups with identical numbers of INs, in ascending order of the silent interval since the last vocalization. (E) Bout length vs. number of INs at bout onset (one bird). Circles represent individual bouts; squares and error bars represent median and inter-quartile range. (F) Number of INs vs. the interval since the last vocalization (same bird as in D). Circles represent individual bouts, squares and error bars represent median values and inter-quartile range. (G) Number of INs vs. interval since the last vocalization (all birds). Symbols represent median values for each bird. Half of the birds are plotted in a different color for clarity. See also Figure S1.

