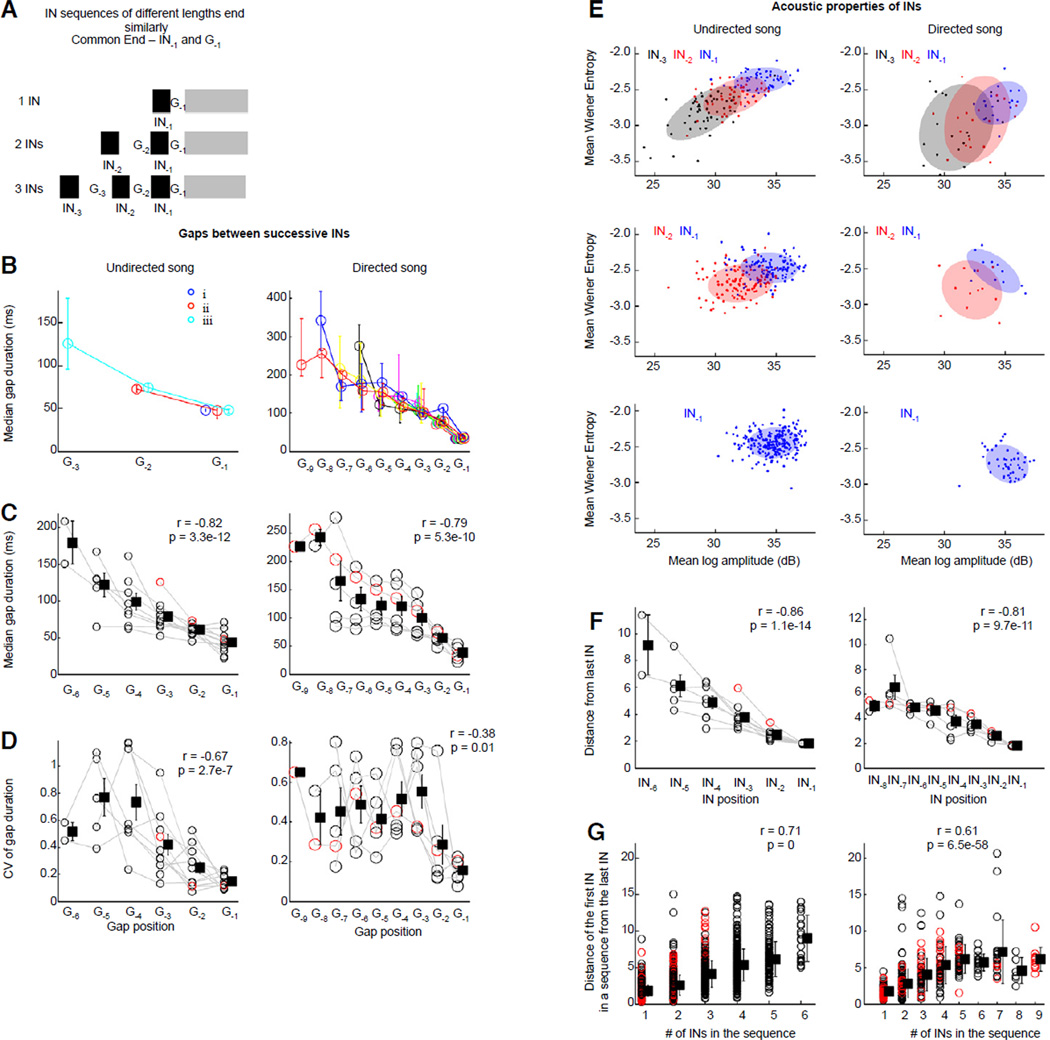
Figure 2.
Intervals between INs become shorter and INs converge on similar acoustic structure across trials. (A) Gap and IN position (white and black bars) in each sequence was represented relative to a common end-point, the gap between the last IN and the motif, called G−1, and the last IN before motif onset, called IN−1. (B) Median gap duration (one bird) vs. gap position across IN sequences of different lengths; undirected, left; n=11 birds, and directed song, right; n=6 birds. Each color represents IN sequences of a particular length, and circles and bars represent median values and inter-quartile range. Values have been slightly offset along the x-axis for clarity. (C, D) Median gap duration (C) and variability of gap duration (D) are negatively correlated with gap position for both undirected, left and directed song, right. Squares and error bars represent mean and s.e.m. Black circles and gray lines represent individual birds, red circles represent bird in B. (E) Two acoustic features (mean log amplitude vs. mean wiener entropy) of INs illustrate the convergence on a similar end state for IN sequences of different lengths (data from one bird; undirected, left, directed song, right). Blue, red, and black symbols represent IN−1, IN−2, IN−3, respectively, and ellipses represent 1 std. from the mean. (F) Acoustic distance (Mahalanobis distance) from the last IN is negatively correlated with IN position, for both undirected (left) and directed song (right). Conventions as in C,D; bird in E shown as red circles here and in G. (G) Acoustic distance of the first IN in a sequence from the last IN was positively correlated with the number of INs in that sequence (undirected, left; directed song, right). Black circles represent individual sequences from all birds, squares represent mean and 1 std across all birds.

