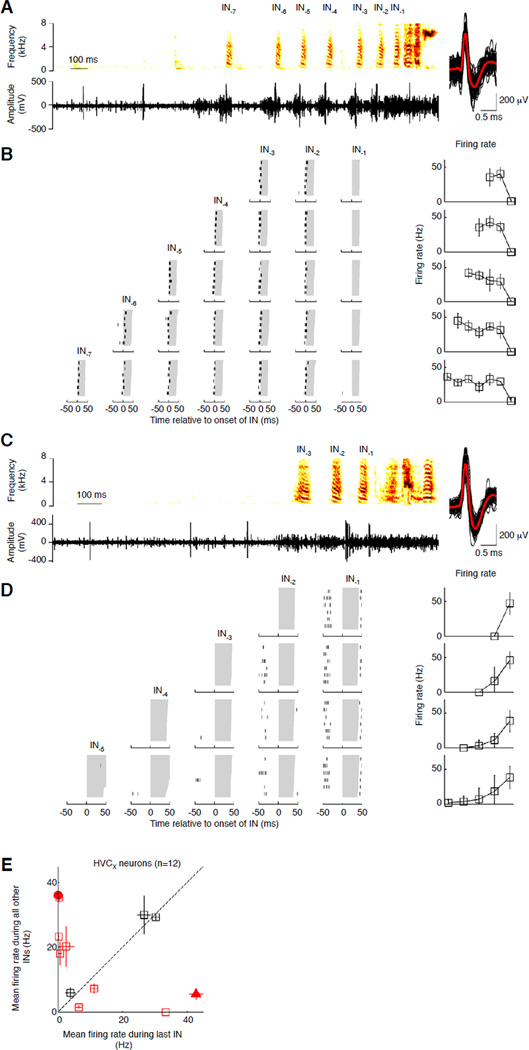
Figure 4.
HVCX projecting neurons fire differently for the last IN. (A, C) Activity of a putative HVCX neuron (A) and an antidromically identified HVCX neuron (C) during the production of one IN sequence. Conventions as in Fig. 3B. Signal-to-noise ratio: 5.63 (A); 8.00 (C). (B, D) Raster plots (left) and mean firing rates (right) for the HVCX neurons shown in A and C respectively during the production of IN sequences of different lengths. Activity was characterized in a 100ms window centered on IN onset; IN durations in gray. Each row of raster plots represents activity during INs from an IN sequence of a specific length, with the mean firing rate as a function of IN position (right). Error bars represent 1 std. (E) Comparison of mean firing rate (+/− s.e.m.) for the last IN vs. all other INs for all HVCX neurons (n=12). Red symbols represent neurons with significant differences (p < 0.05, Kruskal-Wallis analysis of variance), black symbols non-significant differences. The neuron in 4A,B is the red circle, and the neuron in 4C,D the red triangle. See also Figure S3.

