
Figure 3. Covariation of entrapment peptides’ p values.
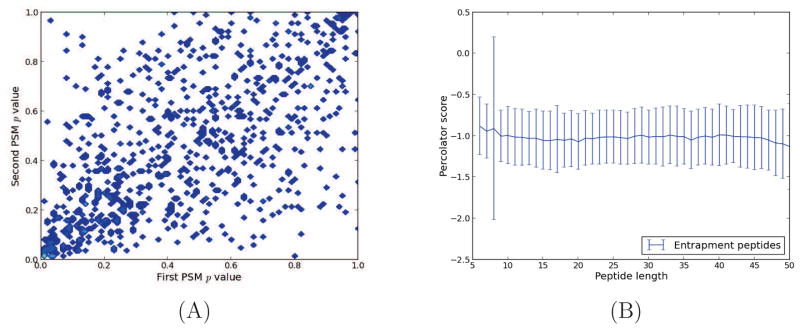
Orbitrap spectra from 10 runs of the ISB18 mix 7 were searched against a bipartite database. For each of the 10 runs, we collected only the entrapment peptides that had been identified twice. (A) Based on their Percolator score, we plotted the two PSM-level p values for each identified peptide (Pearson correlation coefficient = 0.60). Similar covariation was seen for p values estimated using Crux and MSGF+, as well as for the two other standard datasets. (B) The mean Percolator score of entrapment PSMs as a function of peptide length (number of amino acids in peptide sequence). The error bars represent one standard deviation.