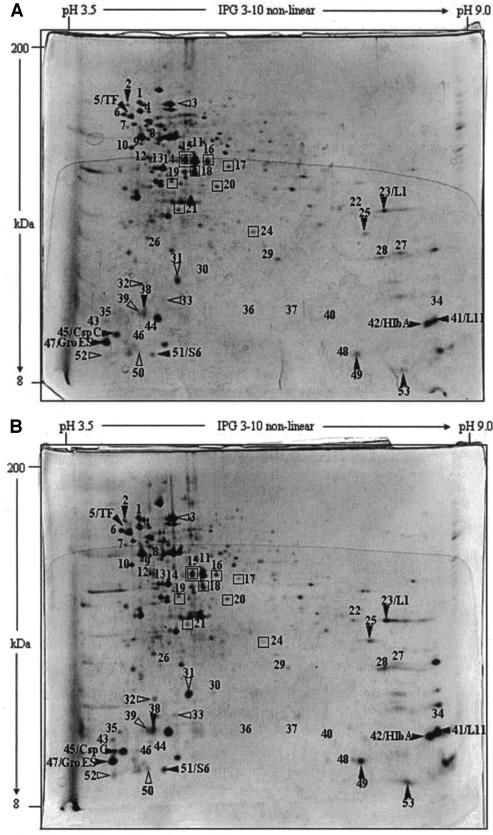
FIG. 6.
2DE analysis of protein expression in L. plantarum DPC2739. (A) Stationary-phase cells grown in MRS broth at 30°C and kept at 30°C for 1 h (control cells); (B) stationary-phase cells grown in MRS broth and heat adapted for 1 h at 42°C (adapted cells). Symbols: ▿ and □, proteins whose amounts were increased and decreased, respectively, compared to the amounts in nonadapted cells; ▾ and ▪, proteins whose amounts were increased and decreased, respectively, compared to the amounts in mid-exponential- and stationary-phase adapted cells. The positions of the following proteins are indicated: DnaK, GroEL, GroES, CspC, trigger factor (TF), ribosomal protein L1 (L1), ribosomal protein L11 (L11), DNA-binding protein II (HlbA), ribosomal protein L31 (L31), and ribosomal protein S6 (S6).

