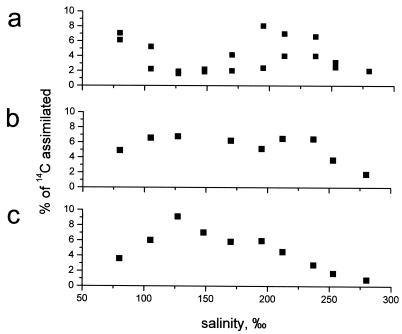
FIG. 7.
Salinity response curves of slurries with the three major phototrophic layers in the crust. The values on y axis are the fraction of [14C]bicarbonate tracer that was assimilated during incubation. Each point represents a single measurement. (a) Surface Halothece-dominated layer; (b) Halospirulina-Phormidium-dominated layer; (c) purple Chromatium-dominated layer.

