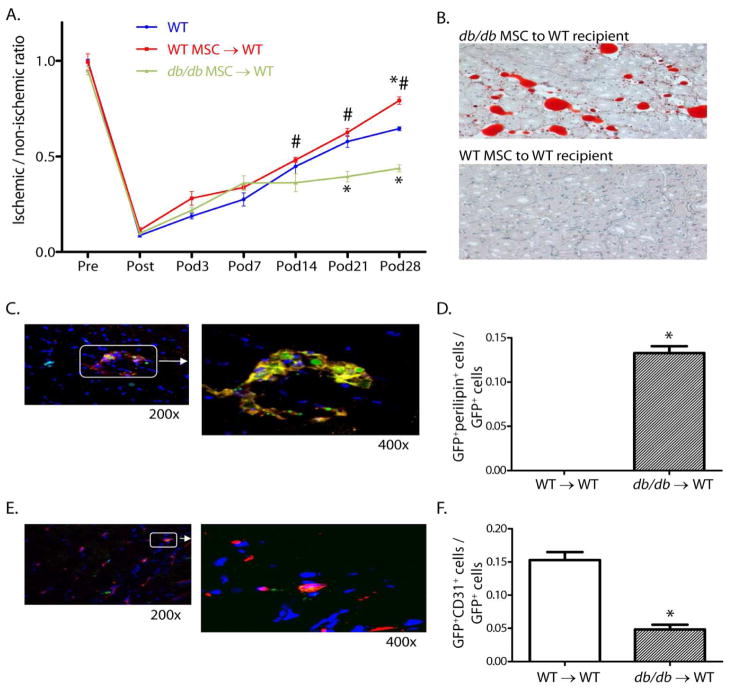
Figure 2.
Foot blood flow recovery, muscle histology, and co-localization studies in WT mice transplanted with db/db or WT MSC after induction of hindlimb ischemia. (A) Foot blood flow recovery by LDPI (mean±SEM; n=6; *P<0.05 vs. WT; #P<0.05 vs. db/db MSC → WT transplant group). (B) Histology of gastrocnemius muscle from the ischemic hindlimb (Oil Red O for identification of adipocytes, hematoxylin counter stain, 200x). (C) Representative confocal images (GFP for identification of MSC [green] and perilipin for identification of adipocytes [red]. (D) Ratio of GFP+periplipin+ cells to GFP+ cells in the ischemic hindlimb muscle (mean±SEM; n=5; *P<0.05). (E) Representative confocal images (GFP for the identification of MSC [green] and CD31 for the identification of endothelial cells [red]). (F) Ratio of GFP+CD31+ cells to GFP+ cells in the ischemic hindlimb muscle (mean±SEM; n=5; *P<0.05). Reprinted with permission from JAHA with the specific citation[43].

