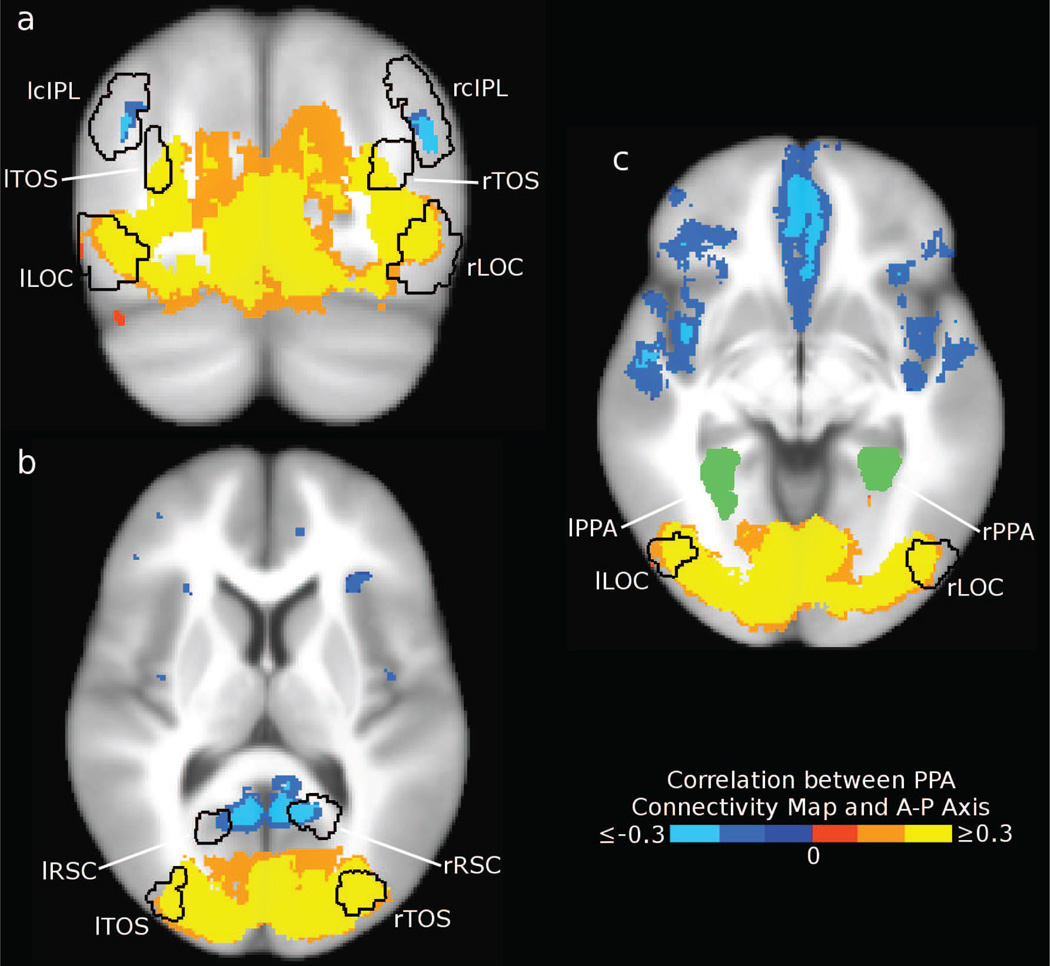
Figure 4. Three slices of the group connectivity bias map.
Seed voxels for which the PPA connectivity map has a strong anterior-posterior gradient (FDR < 0.01, cluster size > 300mm3) are shown in blue (preferential connectivity to anterior PPA) and yellow (preferential connectivity to posterior PPA). (a) In this coronal slice (y=−73mm), we identify bilateral cIPL regions that show a different connectivity pattern from adjacent area TOS. (b) At z=10mm, we observe anterior PPA connectivity in RSC, as well as posterior PPA connectivity in TOS and early visual visual areas. (c) At z=−5mm, ventral occipital areas including LOC show connectivity to posterior PPA. Additionally, anterior PPA connectivity can be seen in the frontal and anterior temporal lobes.

