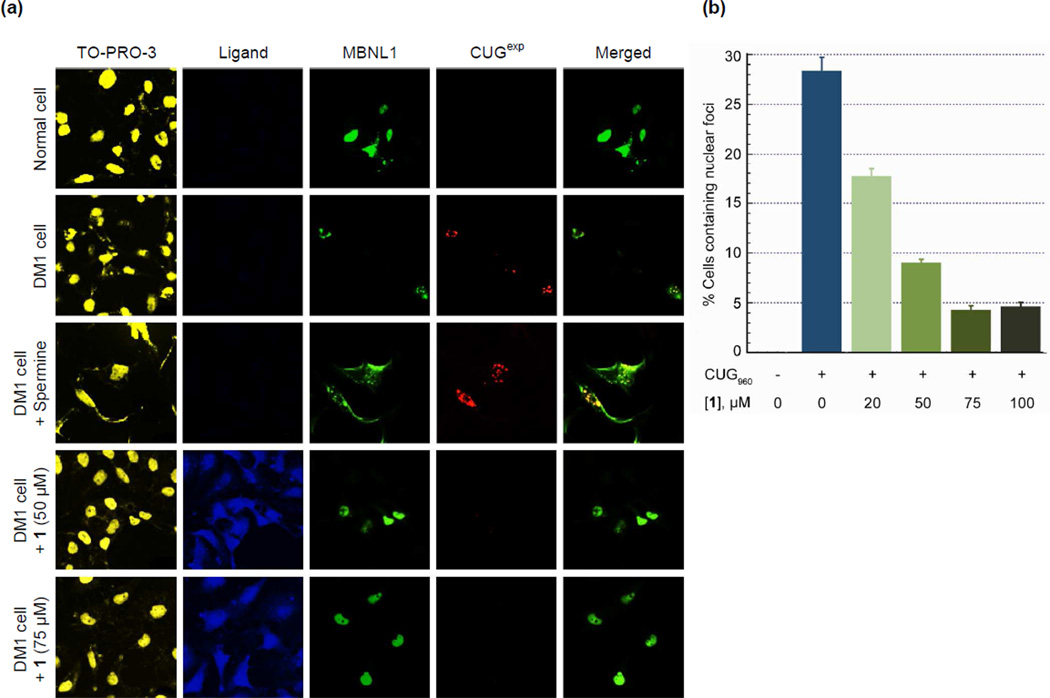
Figure 4.
Ligand 1 disrupts nuclear foci in fixed DM1 cell model. a) Columns 1–4 as labeled. Column 5 is merge of columns 3 and 4. Confocal fluorescent images show MBNL1 and CUGexp foci are present in row 2 where no ligand is added as well as row 3 where spermine (50 µM), as a negative control compound, is added. CUGexp foci are not visible and MBNL1 is dispersed across the nucleus in negative control cells, row 1, as well as rows 4 and 5 where DM1 cell model is treated with 1 at 50 and 75 µM, respectively, for 48 h. Each box shows a 150 µm × 150 µm area. b) Plot of CUGexp foci-containing cell fraction at various concentrations of 1. These data are gathered from scoring over 100 cells. The error bars represent mean ± standard error of at least three independent experiments. A magnified CUG960 transfected HeLa cell (DM1 cell model) showing ribonuclear foci is shown in Supplementary Figure 12.

