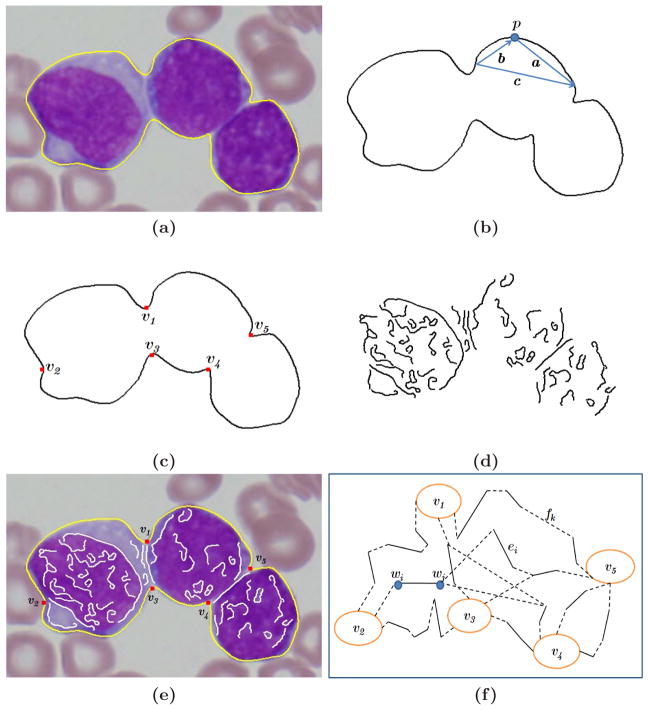
Fig. 3.
Construction of the concave vertex graph. (a) The original image with the yellow boundary contour. (b) High curvature points detection. (c) Concave points detection. (d) Inner edges detection. (e) The outer boundary C, concave vertices V and inner edges E, superimposed on the original image. (f) The constructed concave vertex graph G. The filling edges are shown with dotted lines.

