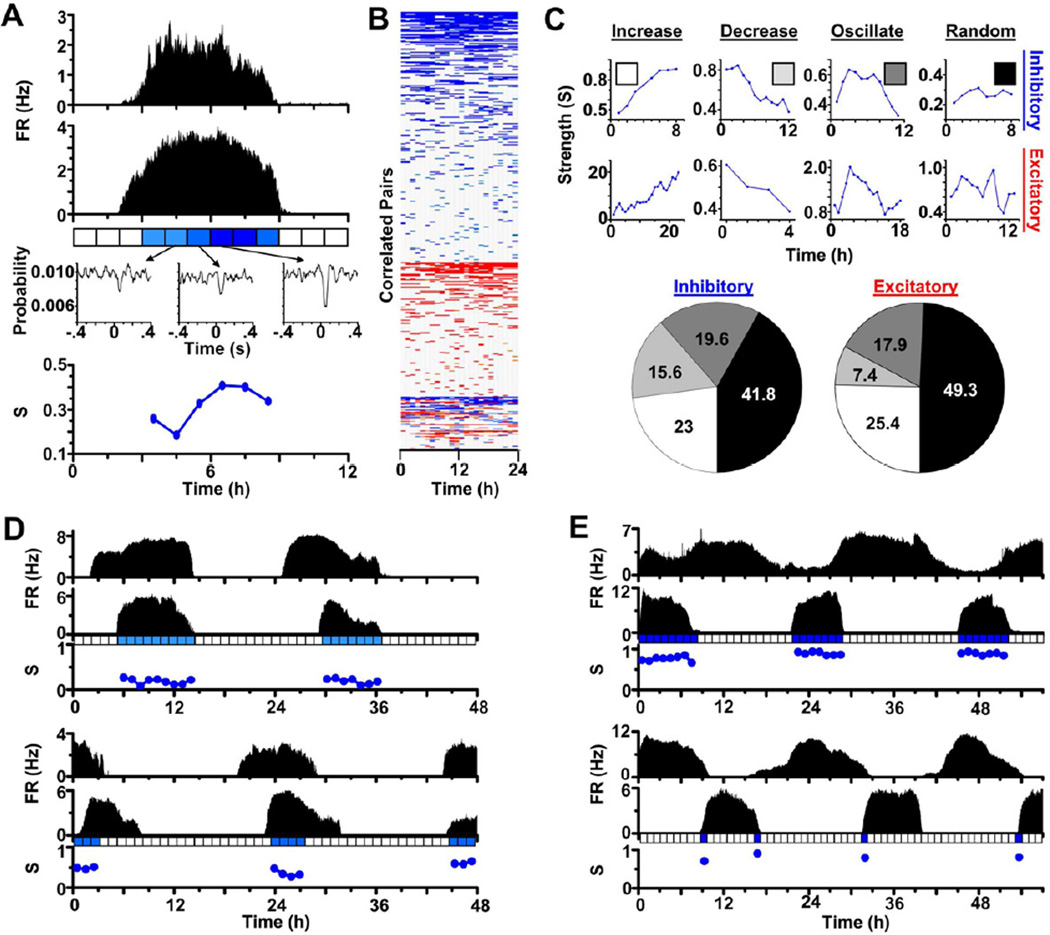
Figure 2. Functional connectivity is dynamic over circadian time.
(A) Circadian firing patterns with firing rate (FR) measured in Hertz (Hz) of two representative SCN neurons and the strength (S, blue circles) of their pair-wise spike-for-spike interaction every hour over one day. Note that the strength of this inhibitory communication increased over the day. (B) A temporal heat map demonstrates how pair-wise interactions between neurons in one SCN network changed in number and strength over 24 h. Each row represents the strength of the connection between a different pair of neurons every hour. Note that most interactions were inhibitory (blue) or excitatory (red) throughout the day while some switched polarity (red and blue). (C) We categorized these representative neuron-neuron interactions as inhibitory (top) or excitatory (middle) and, using least squares fitting, determined whether their strength increased, decreased, oscillated or varied randomly over the day. Pie charts (bottom) show the percentages of each type of interaction within SCN networks (n=189 pairwise interactions that had significant interactions for at least 4 consecutive hours from 3 cultures). Note that the majority of inhibitory and excitatory connections changed with time of day with approximately 25% increasing in strength after the neurons started firing. Smaller fractions of neurons either consistently decreased or increased and then decreased their interaction strength. (D,E) Connectivity persists over days between identified neurons. Here, four representative pairs of neurons with in-phase (D) or anti-phase (E) circadian firing patterns had significant communication over multiple days. Note that an absence of strength measurements does not signify a lack of anatomic connectivity, but rather insufficient spikes to assess activity-dependent functional connectivity.

