Fig. 3.

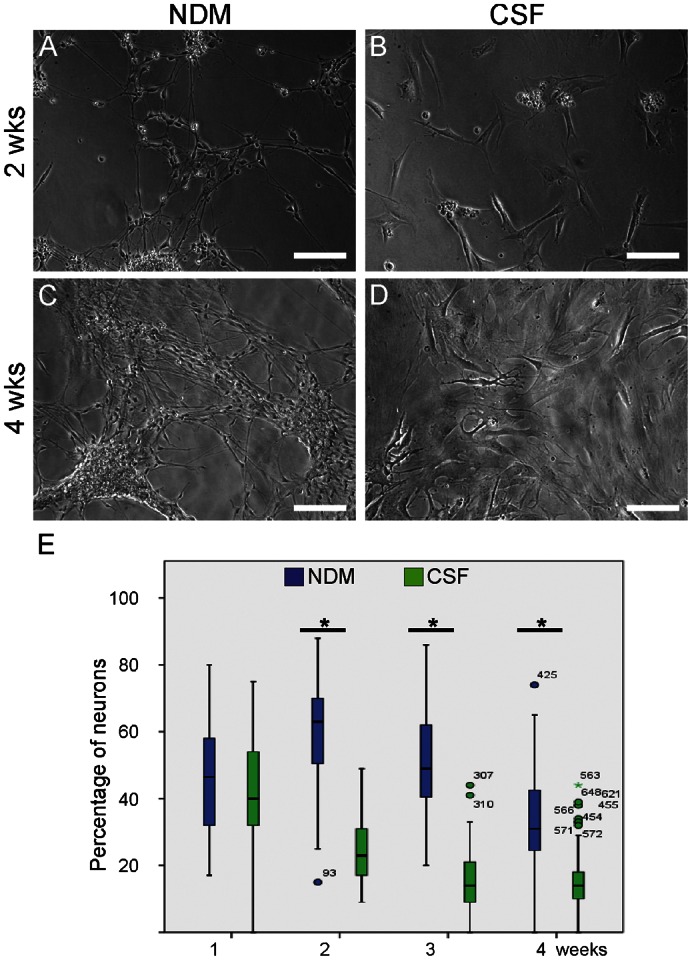
Morphology of the cells cultured in NDM remained neuronal throughout the follow-up period (A,C) but turned into glial-like cells when cultured in human CSF (B,D). (E) The number of neuronal cells cultured in medium or in human CSF during 4 weeks follow-up. The cells were imaged for 48 hours in each time point after which at least 10 of 500×670 µm size images/condition were automatically imaged with design protocol. In total, at least 200 cells/case were automatically analyzed and taken into statistical analysis. The box represents median and upper and lower quartiles, and the bars indicate minimum and maximum values. At time points 2, 3 and 4 weeks there were significantly less neuronal cells detected in CSF cultures when compared to NDM cultures (*P<0.05). Scale bars: 100 µm.
