Figure 5.

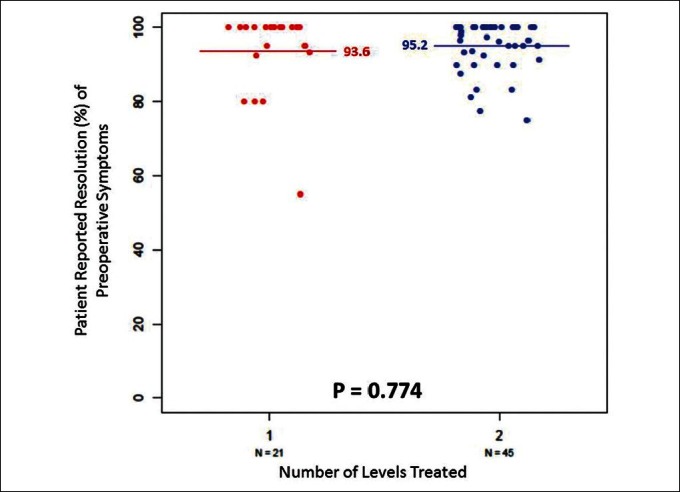
Scatter plot graph reveals no significant difference in clinical outcomes for patients undergoing one vs. two level surgery. (P = 0.774)

Scatter plot graph reveals no significant difference in clinical outcomes for patients undergoing one vs. two level surgery. (P = 0.774)