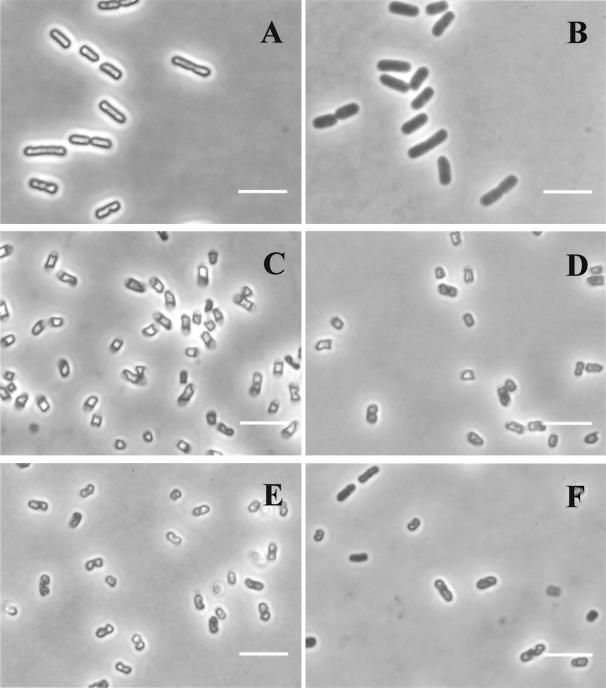
FIG. 3.
Effect of pressure on the osmotic response of E. coli J1. Phase-contrast photomicrographs of exponential- and stationary-phase cells placed on agar containing 0.75 M NaCl are shown. (A) Untreated exponential-phase cells (100% viable cells); (B) exponential-phase cells treated with 200 MPa for 8 min (0.02% viable cells); (C) untreated stationary-phase cells (100% viable cells); (D) stationary-phase cells treated with 200 MPa for 8 min (79% viable cells); (E) stationary-phase cells treated with 500 MPa for 8 min (43% viable cells); (F) stationary-phase cells treated with 600 MPa for 8 min (0.01% viable cells). Bars, 2 μm.

