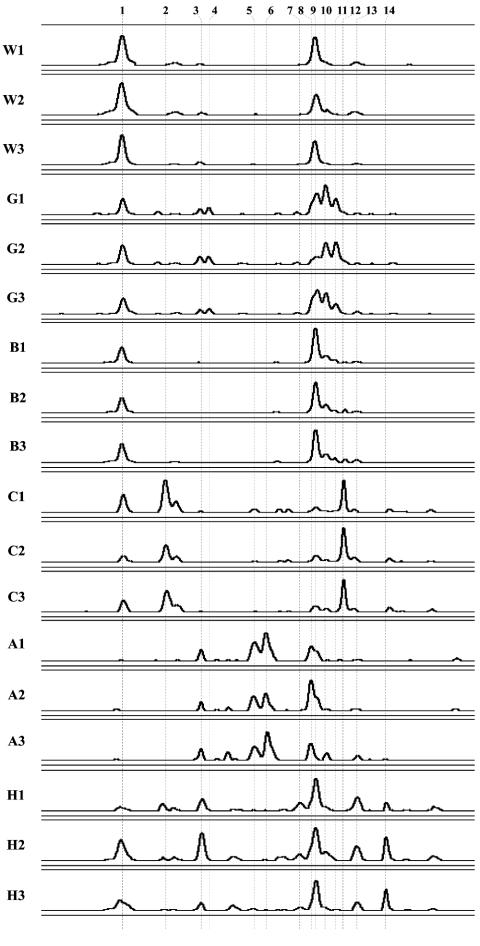
FIG. 2.
PCR-SSCP electropherograms of independent soil samples collected at six locations. Designations: turf, West Madison Agricultural Research Station (W); turf, Walnut St. Research Fields (G); forest, Picnic Point (B); prairie, Curtis prairie (C); agricultural field, Arlington Agricultural Research Station (A); agricultural field, Hancock Agricultural Research Station (H). Three independent soil samples collected 15 cm apart at each location are numbered 1, 2, and 3. For comparisons between samples, individual electropherograms were aligned on the basis of a common internal lane standard. The y axis was adjusted for each electropherogram and represents relative fluorescence intensity, the x axis represents the relative migration distance of the PCR-SSCP DNA fragment. Representative clones for the dominant phylotypes, labeled 1 through 14 across all samples, are MWS38, MCS34, MCS7, MBS11, MCS48, MAS3, MHS15, MAS18, MWS12, MGS4, MGS13, MCS4, MHS2, and MHS12, respectively.

