
Figure 2.
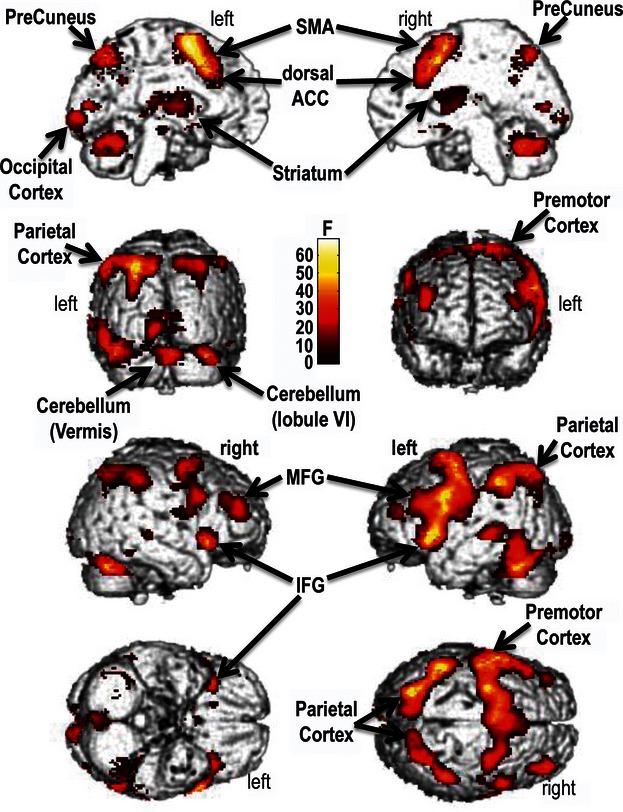
Main effect of task. The brain regions shown are those where the BOLD activity progressively increases as a function of higher working-memory loads. The color bar represents F statistics. Maps are thresholded at P < 0.05, family-wise error (FWE), whole-brain correction. SMA, supplementary motor area; MFG, middle frontal gyrus; IFG, inferior frontal gyrus; ACC, anterior cingulate cortex; BOLD, blood oxygenated level dependant.