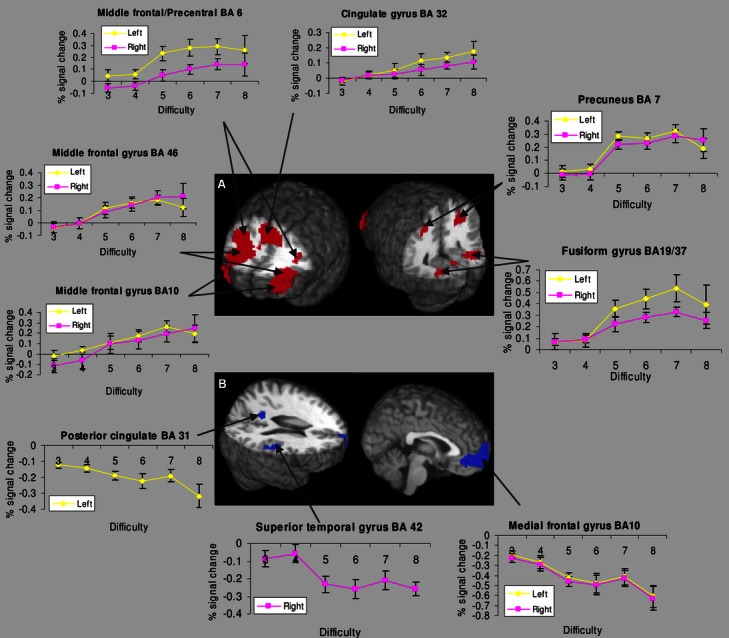
Figure 3.

Brain areas that showed a linear trend as a function of difficulty. (A) Areas that increased in activity and (B) areas that decreased in activity. BA = Brodmann area. Significant activations are reported using False Discovery Rate at q < 0.05 for the linear contrast D3-c2 < D4-c2 < D5-c2 < D6-c2 < D7-c2 < D8-c2. Graphs represent percent signal change and standard error extracted from regions of interest (ROIs) (6 mm in diameter), centred over significantly active regions.
