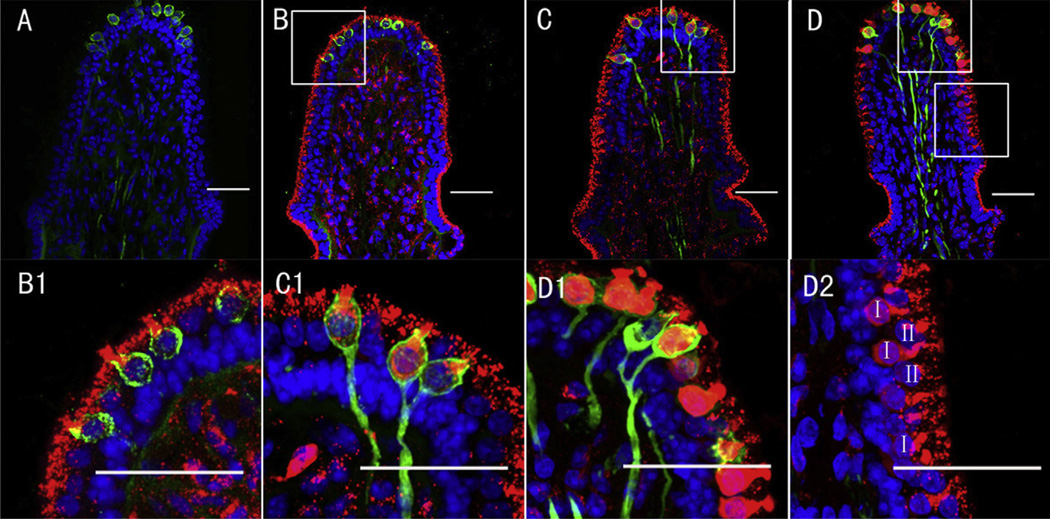
Fig. 4.
Gradient of GTTR intensity from central to peripheral type I hair cells, and beyond to type II hair cells in the crista ampullaris 7 days after transtympanic administration. A: Negligible TR fluorescence (red, if present) in posterior canal 7 days after transtympanic injection of TR. B–D show dose-dependent increased GTTR (red) intensity in hair cells at 7 days after injection of 0.1 (B, B1), 0.4 (C, C1) and 0.8 mg/ml (D, D1 and D2) GTTR. B1–D2 are higher magnifications of the boxes shown in B–D respectively. B1 (0.1 mg/ml) shows punctate GTTR mainly within the apex of type I hair cells with little diffuse fluorescence in the cytoplasm, while C1 (0.8 mg/ml) shows more GTTR fluorescence throughout the cytoplasm. D2 shows decreased GTTR fluorescence intensity in peripheral type I and type II hair cells compared to central zone type I hair cell (D1) in the crista ampullaris. Blue represents DAPI labeling of ds-DNA in the nuclei of cells and green represents calretinin immunofluorescence. I, type I hair cell; II, type II hair cell. Scale bar = 20 µm. (For interpretation of the references to colour in this figure legend, the reader is referred to the web version of this article.)

