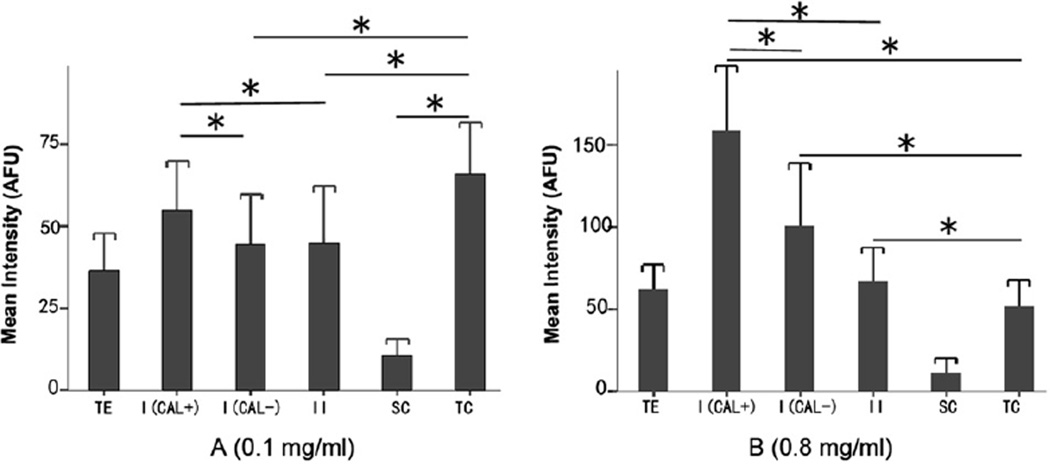
Fig. 5.
Comparison of intensity of GTTR fluorescence among different cell types of posterior crista ampularis 7 days after transtympanic administration (A: 0.1 mg/ml; B: 0.8mg/ml; n = 4 per end-organ). The fluorescence intensity of the whole total sensory epithelium in each transverse section was obtained by measuring all epithelial elements above the basement membrane. Intensities of GTTR fluorescence in calretinin-positive type I hair cells, calretinin-negative type I hair cells, type II hair cells, supporting cells and transitional cells were averaged and plotted in 0.1 mg (A) and 0.8 mg (B) groups respectively. More GTTR fluorescence was present in sensory epithelial regions containing central type I hair cells than peripheral type I hair cells or type II hair cells of the ampullar sensory epithelium for both 0.1 mg (P < 0.05) and 0.8 mg groups (P < 0.001). Transitional cells had more GTTR fluorescence than calretinin-negative type I (P < 0.001), II hair cells (P < 0.05), and support cells (P < 0.001), but not compared to calretinin-positive type I hair cells (P = 0.297) in 0.1 mg/ml group. In 0.8 mg/ml group, transitional cells took up less intense GTTR fluorescence than calretinin-positive and calretinin-negative type I (P < 0.001) and type II hair cells (P < 0.001). Qualitatively less GTTR fluorescence was detected in supporting cells. Error bars are 1 standard deviation from the mean. TE, total epithelium; I (CAL+), calretinin-positive type I hair cell; I (CAL–), calretinin-negative type I hair cell; II, type II hair cell; SC, supporting cell (within the sensory epithelium, below the hair cell layer); TC, transitional cell.

