Figure 6.

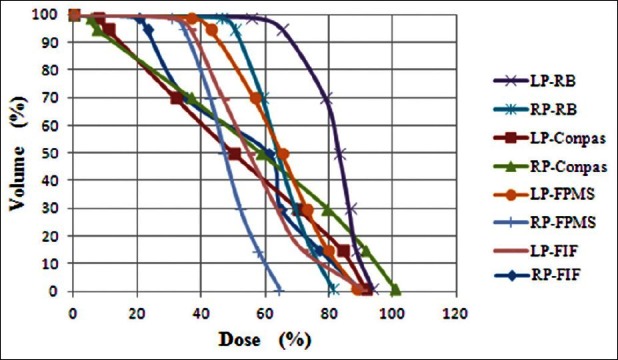
Comparison of dose-volume histograms obtained for parotid glands with the four planning techniques for one example patient. RP = right parotid; LP = left parotid

Comparison of dose-volume histograms obtained for parotid glands with the four planning techniques for one example patient. RP = right parotid; LP = left parotid