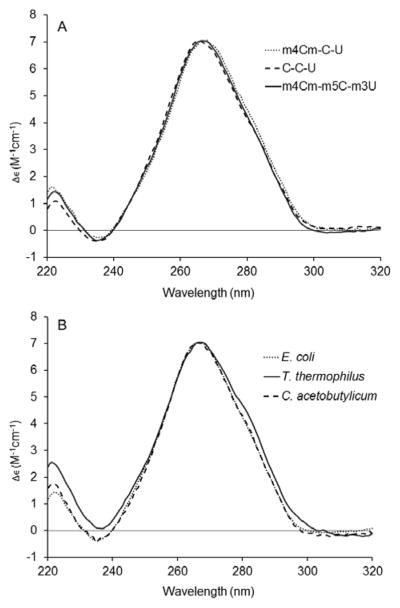
Figure 3.

The circular dichroism spectra of the decoding region analogues (panel A: unmodified C-C-U, singly modified m4Cm-C-U, and fully modified m4Cm-m5C-m3U (wild type); panel B: decoding regions from E. coli, C. acetobutylicum and T. thermophilus) are shown. Each curve represents the average of five scans taken at room temperature.
