
Figure 3.
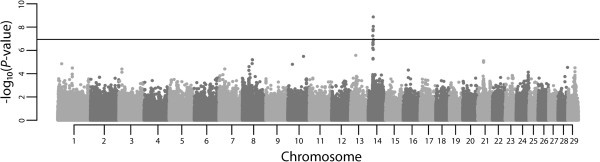
Manhattan plot of genome-wide -log10(P-values) for birth weight estimated breeding values in Nellore cattle. The horizontal line represents the Bonferroni significance threshold (α = 1.15 × 10⁻⁷).
Official websites use .gov
A
.gov website belongs to an official
government organization in the United States.
Secure .gov websites use HTTPS
A lock (
) or https:// means you've safely
connected to the .gov website. Share sensitive
information only on official, secure websites.
Manhattan plot of genome-wide -log10(P-values) for birth weight estimated breeding values in Nellore cattle. The horizontal line represents the Bonferroni significance threshold (α = 1.15 × 10⁻⁷).