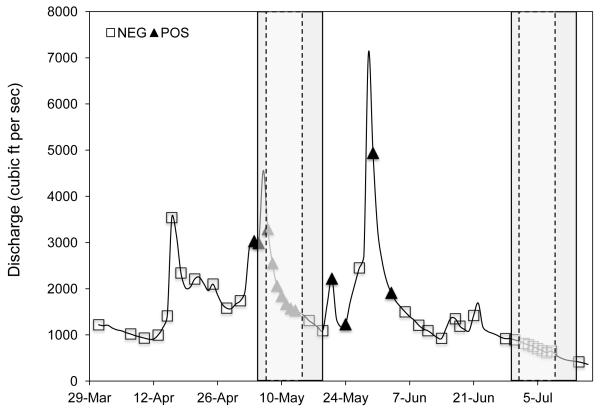
Figure 1.
The temporal occurrence of atrazine was determined using atrazine test strips. Elkhorn River hydrograph data was used to highlight the use of atrazine as a surrogate to predict the occurrence of agrichemical runoff. Positive atrazine test strip results are shown as closed triangles while negative test results are represented as open boxes. The pulse and post-pulse POCIS deployment periods are highlight by the dark grey bars. The 7 d exposure periods during which water was collected from the Elkhorn River are denoted by the light grey bars within the dashed lines.

