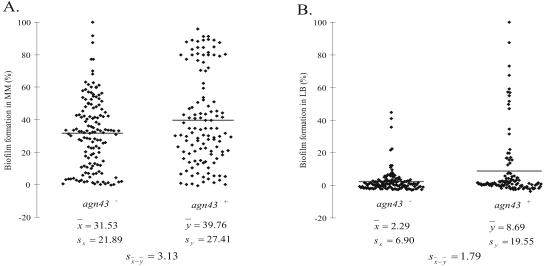
FIG. 5.
Biofilm formation in minimal medium (MM) supplemented with glucose (A) and LB (B). Biofilm intensity was expressed as a percentage of the highest biofilm formed in each medium. Each dot is the average from three independent experiments for each isolate. The horizontal bar is the mean value of the biofilm formation in that subpopulation. X̄, mean biofilm formation in agn43-deficient subpopulation; Ȳ, mean biofilm formation in agn43+ subpopulations; SX and Sy, estimated standard deviations of x and y, respectively; Sx̄−ȳ, estimated standard deviation of x̄ − ȳ.

