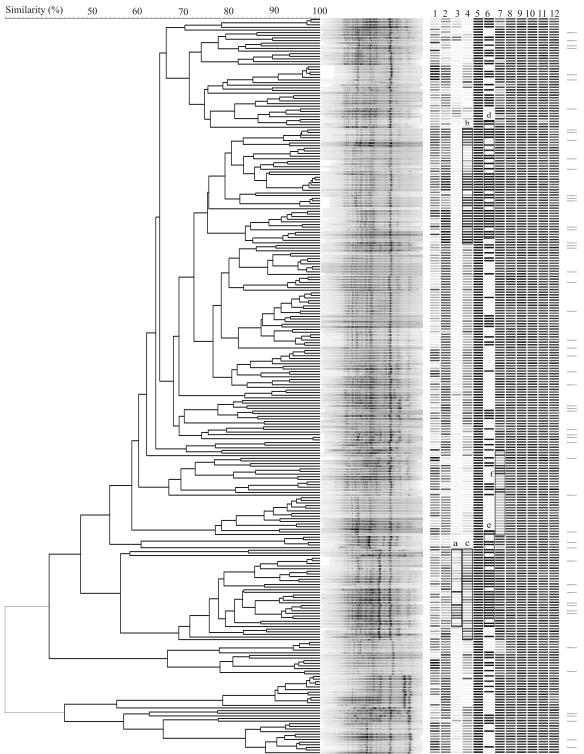
FIG. 6.
Clustering of E. coli feedlot isolates based on BOX-PCR fingerprint pattern. Corresponding phenotypes are shown on the right panel as gray bars: depth of origin (lane 1), motility (lane 2), biofilm formation in LB (lane 3), biofilm formation in minimal medium (lane 4), presence of fimH (lane 5), presence of agn43 (lane 6), and resistance to tetracycline (lane 7), streptomycin (lane 8), polymyxin (lane 9), chloramphenicol (lane 10), carbenicillin (lane 11), and erythromycin (lane 12). The gray scale of the bars was obtained as follows: depth is shown as the proportion to total sampling depth, the degree of motility is shown relative to maximum motility, biofilm formation is shown relative to the highest biofilm formed in each medium, fimH and agn43 are shown as present (black) or absent (white), and antibiotic resistance is shown as the relative size of the clear zone compared to the maximum clear zone for the individual antibiotic. Horizontal bars at the far right indicate isolates that were confirmed to have E. coli biochemical fingerprints by API-20E testing.

