
Figure 6.
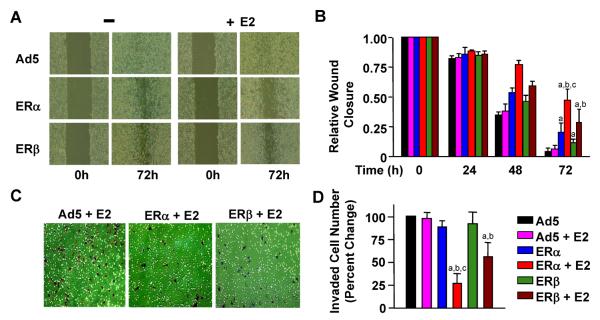
Fig. 6 Effects of ERs on the motility of infected MDA-MB-231 cells. Infected cells were incubated in the absence or presence of 10−9 M E2 for 48 h to allow cells to reach confluence. A wound was then created and images were captured at 0 and 24-h intervals. a Representative images of wound closure in response to Ad5, ERα, or ERβ in the absence (−) or presence of E2 (+E2) at 72 h are shown. b Graph represents the quantitative analysis of images that depict the wound closure at different time points relative to 0 h. Superscript (a) indicates responses that are significantly different from those observed with cells infected with Ad5 in the absence of E2. Superscript (b) denotes responses that are significantly different from responses to ERs in the absence of E2, while superscript (c) indicates responses that are significantly different from responses to ERβ + E2. c MDA-MB-231 cells were infected with recombinant adenoviruses in the absence or presence of 10−9 M E2 for 48 h. Cells were collected and counted. The same number of cells from each experimental group was then seeded on the invasion chamber membrane. After 24 h incubation, cells with invasive capabilities on the bottom of chamber membrane were stained (brown) and imaged. d Cells counted on the bottom of the invasion chamber are given as the percent change in cell numbers relative those infected with the parent Ad5, which is set to 100. Each data point represents the mean ± SEM of three independent experiments performed in duplicate. Superscript (a) indicates responses that are significantly different from those observed with cells infected with Ad5 in the absence of E2. Superscript (b) denotes responses that are significantly different from those observed with cells synthesizing ERs in the absence of E2. Superscript (c) denotes responses that are significantly different from responses to ERβ + E2