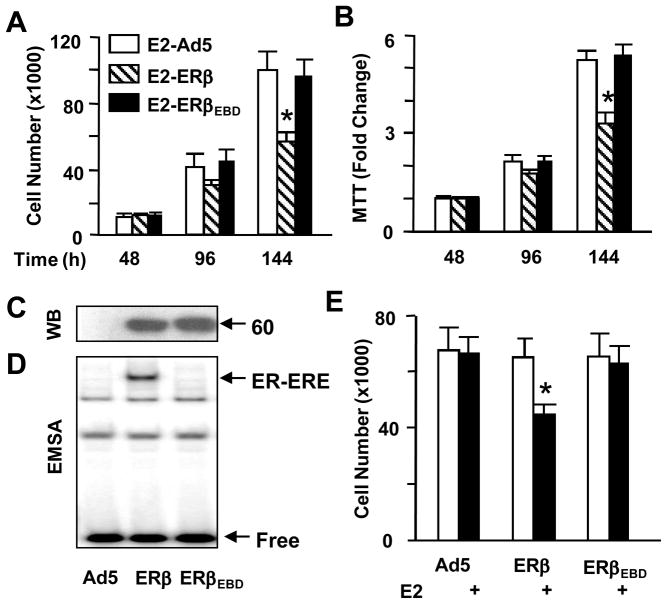
Fig. 5.
Effects of ERβs on cell growth. (A & B) Infected MDA-MB-231 cells were maintained in the absence (data not shown) or presence of 10−9 M E2. At 48, 96 and 144h post-infection, cells were subjected to cell counting (A), or (B) MTT assay. The graphs represent the mean ± SEM of three independent experiments performed in duplicate. (C & D) U-2 OS cells were infected with Ad5 (50 MOI), Ad-5ERβ (40 MOI supplemented with 10 MOI of Ad5) or Ad5-ERβEBD (50 MOI) for 48h. Cell extracts were subjected to WB (C) and EMSA (D). Molecular weight in KDa is shown. Free (unbound) and the ER-bound ERE are indicated. Representative images from three independent experiments are shown. (E) Infected U-2 OS cells were maintained in the absence or presence of 10−9 M E2. At 144h post-infection, cells were subjected to cell counting. The mean ± SEM indicates three independent experiments performed in duplicate. * denotes a significant effect compared to the parent adenovirus (Ad5).

