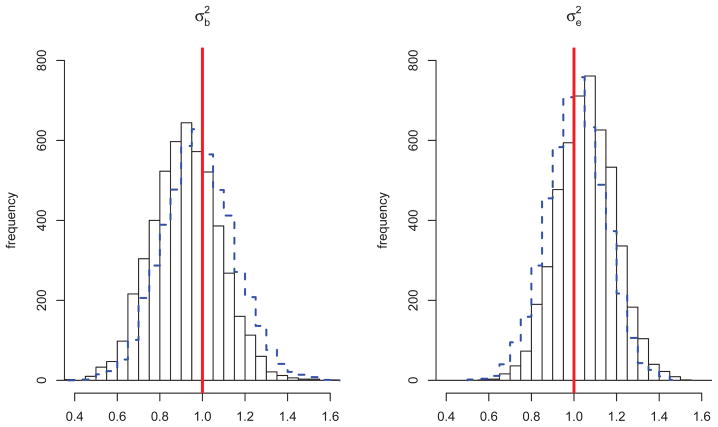
Figure 5.
Distribution of Variance Component Estimates under the null hypothesis of no SNP Set effect: histograms with solid, black borders are for estimates computed using non-random selection of families (ascertained according to disease status), while the overlaid histograms in dashed-blue are for estimates computed using random selection of families. True parameter values are indicated by vertical red lines.

