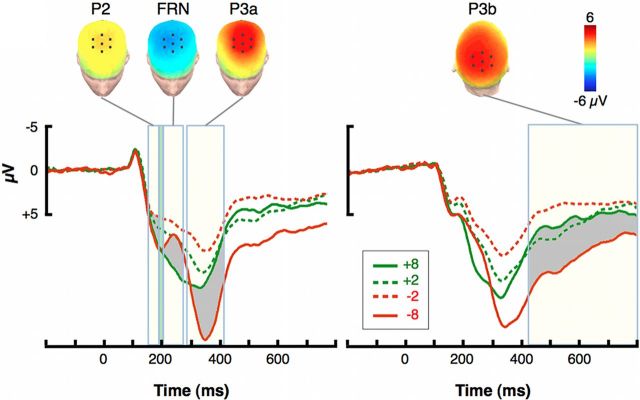
Figure 3.
Feedback-locked ERPs and their distribution over the scalp. Left, ERP traces, Grand averages for each outcome from a frontal ROI of seven electrodes centered on FCz and located over frontocentral cortex. Cream-colored rectangles show the time windows defined for each of the ERP components. The thin rectangle in light green, immediately preceding the FRN time window, represents the reference latencies for quantifying the FRN amplitude. Shadowed areas correspond to the contrasts presented in the topographies above. Left, ERP topographies, Distribution of key effects for each ERP component over the scalp and location of the frontal ROI. The topography of the P2 effect is presented in terms of the −8 minus −2 contrast, whereas the FRN and P3a are presented in terms of the −8 minus +8 contrast. The topographies were constructed subtracting the average activity for the two contrast conditions over the specified time window defined for each component. Right, ERP traces, Grand averages from each outcome from a parietal ROI of seven electrodes centered on Pz and located over the parietal cortex. Right, ERP topographies, Distribution of key effects for each ERP component over the scalp and location of the parietal ROI. The topography of the P3b effects is presented in terms of the −8 minus +8 contrast.

