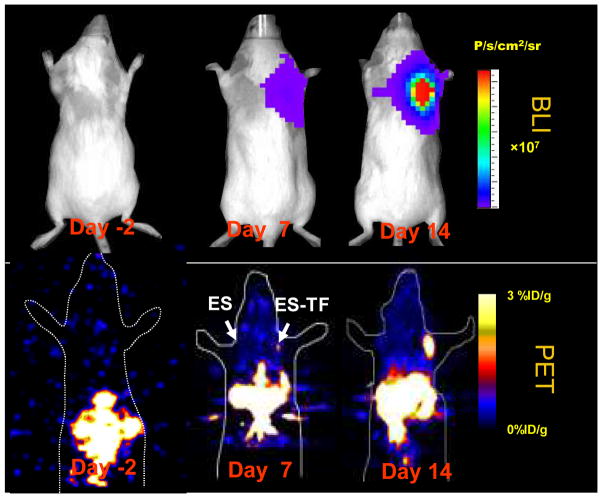
Figure 5.
Noninvasive imaging of ES cell transplant in living subjects. Bioluminescence (top row) and PET imaging (bottom row) of a representative animal before (day −2) and after ES cell transplantation (days 7 and 14). The survival of control ES cells in the left shoulder could not be assessed because they lack reporter genes. In contrast, ES-TF cells transplanted into the right shoulder showed progressive increases in bioluminescence and PET signals at days 7 and 14, reflecting both cell survival and cell proliferation during this period. The bioluminescence activity is quantified as units of photons per second per centimeter square per steridian (p/s/cm2/sr). The PET activity is quantified as percentage of injected dose of [18F]-FHBG per gram of tissue (% ID/g). Note significant PET activity is also seen in the gut region due to the natural excretion and clearance route of [18F]-FHBG.

