Figure 3.
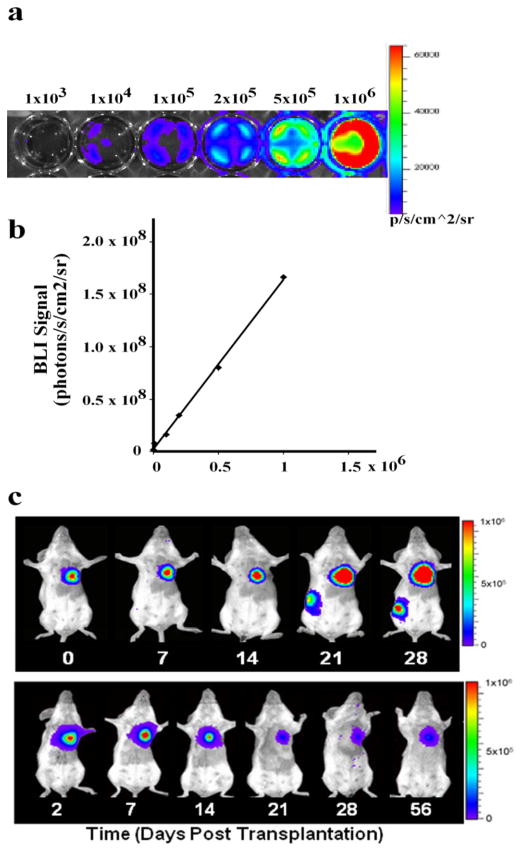
Bioluminescence imaging of transplanted ES cells. (a) Ex vivo BLI of undifferentiated DF human ES cells (H9 line). The numbers on top of the bioluminescence images indicate the number of cells seeded in the culture dish. Representative images from replicate experiments are shown. (b) Linear correlation of cell numbers and BLI signals (photons/second/cm2/steridin) in (a) (R2=0.99). (c) Tracking in vivo kinetics of transplanted DF hES cells and DF hES cell-derived cardiomyocytes with BLI. Representative images from a single animal receiving intramyocardial injection of 1×10⁶ undifferentiated DF hES cells (upper panel) or DF hES-derived cardiomyocytes (lower panel) are shown. Images were taken at the time point as indicated. Appropriate animal protocol has been approved by the Administrative Panel on Laboratory Animal Care of Stanford University. Data in c were reproduced with permission from ref. 25.

