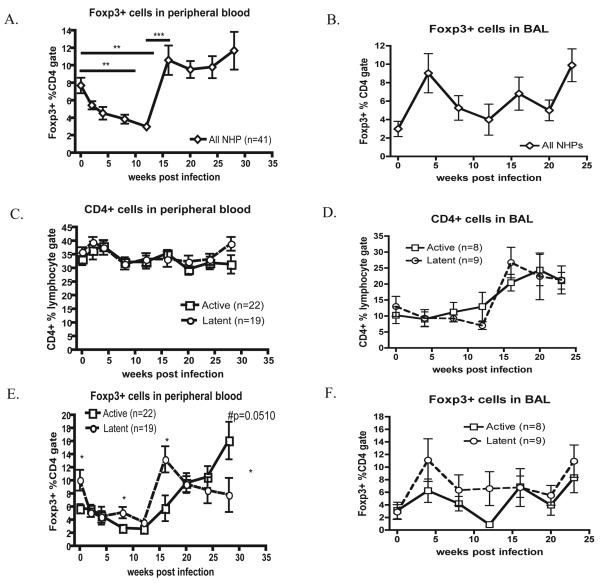
Figure 3. Tregs in PBMC and airways during M. tuberculosis infection.
A) The frequency of Tregs (CD3+CD4+Foxp3+) in PBMC during M. tuberculosis infection (n=41 monkeys) was determined by gating on live cells, lymphocytes and CD3+CD4+ cells. B) BAL cells from infected NHPs (N=17) were stained and gated as above. p <0.05 was considered significant. PBMCs and BAL cells were stained and compared between active disease (open squares) and latently infected (open circles) groups. The frequency of CD4 T cells within the lymphocyte gate (C,D) or Foxp3+ cells within CD4 gate (E, F) for blood (C, E) and airways (B, D) are represented. Statistical significance over time (A) was determined by repeated measure ANOVA (p<0.0001) with a Tukey-Newman post-test. (C-F) Mann-Whitney determined significance between each group at each time point.

