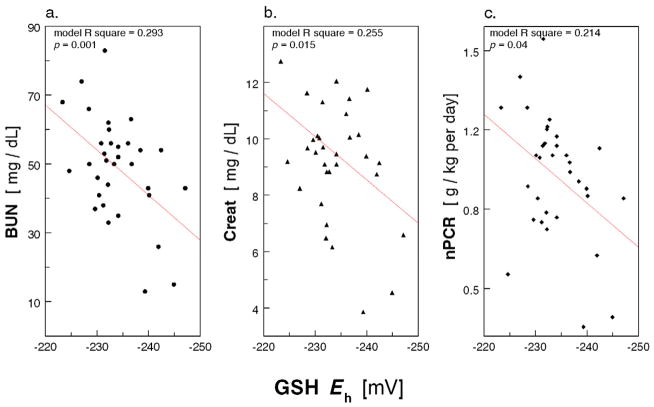
Figure 4.
Scatter plot of RBC GSH/GSSG redox power (Eh, mV × 102) with (a) serum blood urea nitrogen (BUN, mg/dL); (b) creatinine (Creat, mg/dL); and (c.) normalized protein catabolic rate (nPCR, g/kg per day) in 33 Maintenance HD Patients (multiple regression models with age, race and diabetes as covariates).

