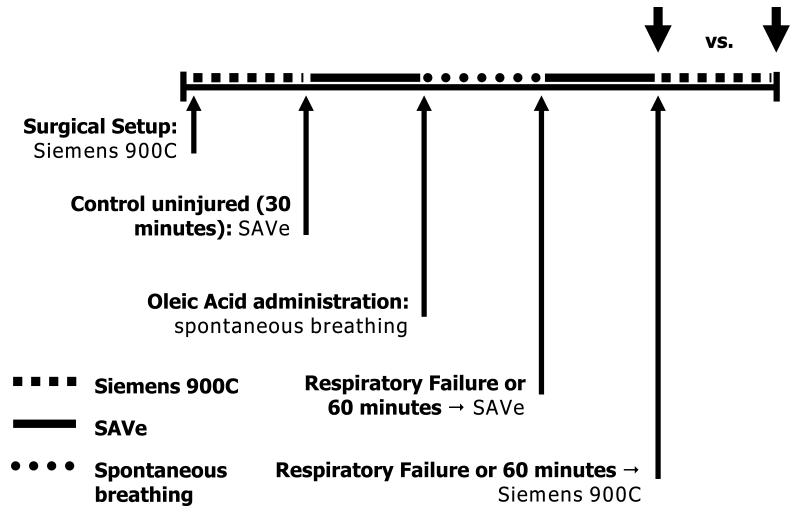
Figure. Flow diagram of experimental model.
Each animal was initially ventilated while baseline data was obtained. Anesthesia was then lightened to allow for spontaneous respirations. Lung injury was then induced. Pigs continued to breathe spontaneously until respiratory failure when they were moved to SAVe ventilator. Upon failure of the SAVe ventilator, or after a one hour period, they were ventilated with the Siemens Servo 900C. Comparisons of ventilator capability to support each pig was made at the end of each time period (Large arrows).

